
Figures & data

Figure 1. PRISMA flow diagram
a12 articles in English and 7 articles in Korean language
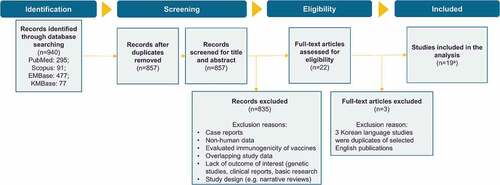
Table 1. Proportion of cases with positive detection of pertussis (n = 19)
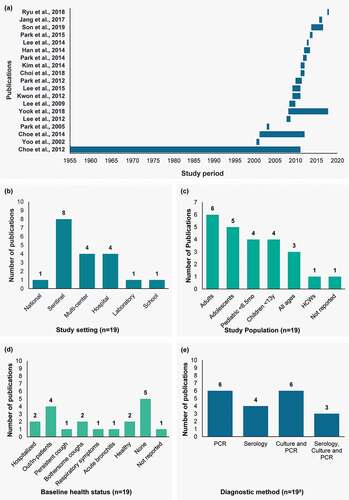
Figure 2. Study characteristics. (a) Study period, (b) study setting, (c) study population, (d) baseline health status, and (e) diagnostic method
HCW, healthcare worker; m, months; PCR, polymerase chain reaction.aThe total number of studies depicted in the figure is 24 as five studies reported information for more than one group.Citation22,Citation24–27
Supplemental material