
Figures & data
Table 1. Participant characteristics
Table 2. Descriptive statistics for continuous items measuring beliefs and attitudes about COVID-19 and a COVID-19 vaccination and vaccination intention. Data are mean (standard deviation) on a 0–10 numerical rating scale (0 = strongly disagree, 10 = strongly agree)
Table 3. Descriptive statistics for categorical and ordinal items measuring beliefs and attitudes about COVID-19 and a COVID-19 vaccination
Figure 1. Perceived likelihood of having a vaccination (0 = “extremely unlikely” to 10 = “extremely likely”). The figure also shows cutpoints that we used to categorize respondents in terms of their vaccination intention (into three categories of very unlikely, uncertain, and very likely to be vaccinated)
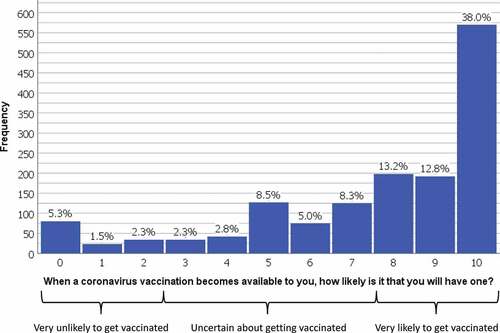
Table 4. Results of the full linear regression model analyzing associations with vaccination intention (adjusted R2 =.763). Parameter estimates relate to the full model containing all predictors. The unstandardized regression coefficients represent the change in likelihood of vaccination for a one-unit increase in the predictor variable (or, for dummy variables, a shift from the reference category to the category concerned). The figures under ‘% variance explained’ represent the percentage of variance in the outcome variable uniquely explained by the item (or set of dummy variables) concerned. The model was based on 1437 cases with complete data