4,011
Views
21
CrossRef citations to date
0
Altmetric
Research Paper

Public health impact and cost-effectiveness of catch-up 9-valent HPV vaccination of individuals through age 45 years in the United States

ORCID Icon, , ORCID Icon, ORCID Icon, , & show all
Pages 1943-1951 | Received 20 Aug 2020, Accepted 14 Nov 2020, Published online: 10 Jan 2021

Figures & data

Figure 1. Vaccination coverage for 9–45-year-old females and males over historical and analytic time horizon. The dashed segment is the historical coverage for this age group from 2007 to 2019 where it reaches 29.2% coverage. The lower curve is the status quo coverage from 2019 to 2119 with a final coverage of 73.8%. The upper curve is the expanded catch-up program coverage from 2019 to 2119 with a final coverage of 77.1%

Figure 1. Vaccination coverage for 9–45-year-old females and males over historical and analytic time horizon. The dashed segment is the historical coverage for this age group from 2007 to 2019 where it reaches 29.2% coverage. The lower curve is the status quo coverage from 2019 to 2119 with a final coverage of 73.8%. The upper curve is the expanded catch-up program coverage from 2019 to 2119 with a final coverage of 77.1%

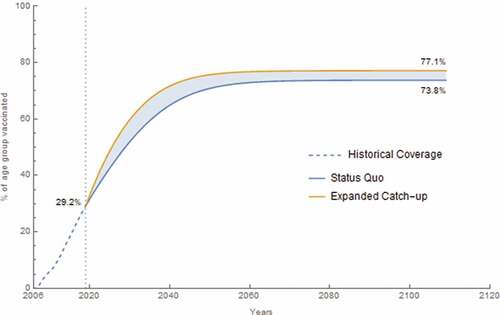
Table 1. Cumulative HPV 6/11/16/18/31/33/45/52/58-related total diseases cases and deaths and cases averted over a 100-year time horizon, base case analysis

Figure 2. Pre-vaccine era cumulative proportion of the age at acquisition of HPV infection. The cumulative proportion of HPV infection was calculated for all female high-risk HPV infection acquired by age. The proportion was calculated by summing all new incident HPV 16/18/31/33/45/52/58 infections within each age group, dividing by the total infections over all age groups and accumulating through each age group

Figure 2. Pre-vaccine era cumulative proportion of the age at acquisition of HPV infection. The cumulative proportion of HPV infection was calculated for all female high-risk HPV infection acquired by age. The proportion was calculated by summing all new incident HPV 16/18/31/33/45/52/58 infections within each age group, dividing by the total infections over all age groups and accumulating through each age group

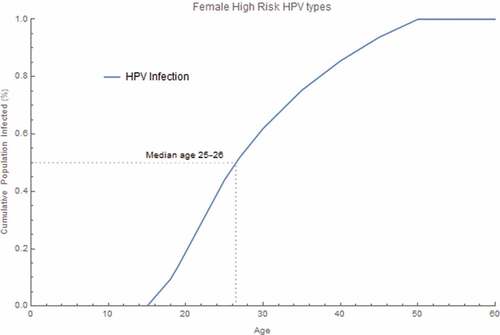
Table 2. Cost-effectiveness results for base case analysisab.

Table 3. Cost-effectiveness for expanded HPV Vaccination: incremental increase of upper age limit of expanded catch-upa.

Table 4. Cost-effectiveness results for sensitivity analysisa.

Supplemental material

Supplemental Material

Download MS Word (1.6 MB)