
Figures & data
Figure 1. The sampling scheme of the cross-sectional survey on HB awareness, individual vaccination history, and detailed household characteristics
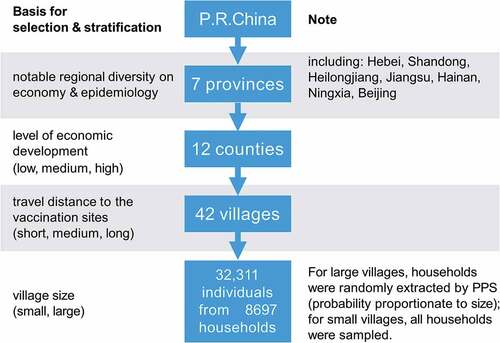
Figure 2. Spatial distribution of discrimination across 42 villages
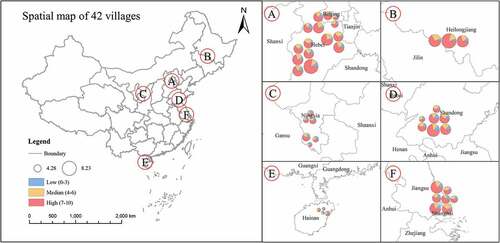
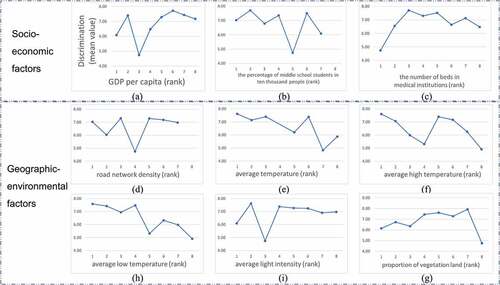
Figure 3. Diagram of the relationship between independent variables and the mean value of HB discrimination
Appendix Table 1. Indices of six variable categories
Appendix Table 2. Details of socio-economic data
Appendix Table 3. Details of geographical environment data
Appendix Table 4. Information about the instrument used to collect the data
Appendix Table 5. Descriptive statistics for socio-demographic characteristics of participants
Appendix Table 6. Vaccination behavior and willingness in 42 villages
Appendix Table 7. HB discrimination score of each village
Appendix Table 8. The results by the geographical detector