Figures & data
Table 1. Distribution of the vaccine hesitancy reasons reported in the WHO/UNICEF Joint Reporting Form, coded based on the Vaccine Hesitancy Matrix, 2014–2017
Table 2. Examples of the responses coded based on the Vaccine Hesitancy Matrix, using the data reported in the WHO/UNICEF Joint Reporting Form, 2014–2017
Figure 1. Vaccine hesitancy trends using the WHO/UNICEF Joint Reporting Form data on open-ended responses for 2017
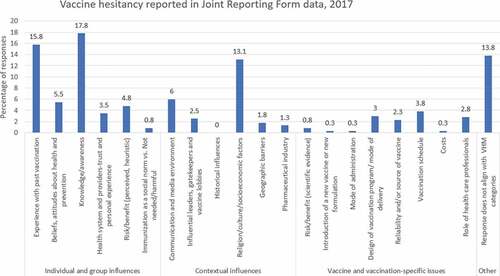
Figure 2. Percentage of responses for the two quantitative content analyses, using the WHO/UNICEF Joint Reporting Form data on open-ended responses coded as the individual and group influences for vaccine hesitancy, 2014–2016
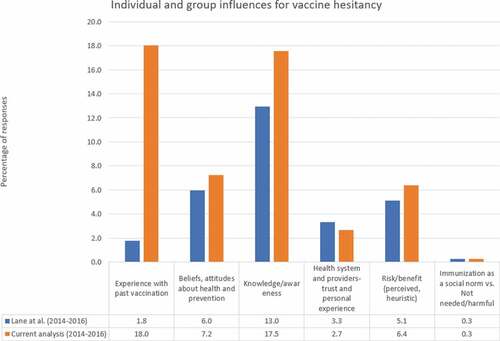
Figure 3. Percentage of responses for the two quantitative content analyses, using the WHO/UNICEF Joint Reporting Form data on open-ended responses coded as the contextual influences for vaccine hesitancy, 2014–2016
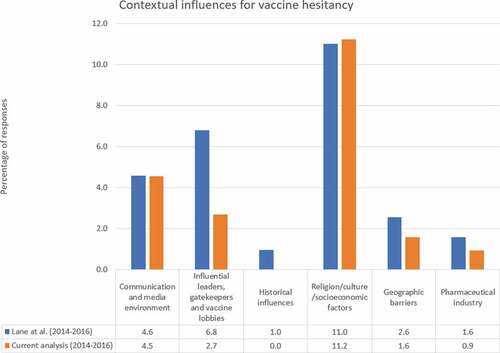
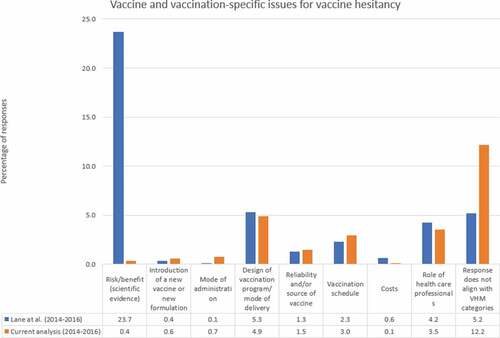
Figure 4. Percentage of responses for the two quantitative content analyses, using the WHO/UNICEF Joint Reporting Form data on open-ended responses coded as vaccine- or vaccination-specific influences for vaccine hesitancy, 2014–2016