Figures & data
Table 1. The table compares between the R0 of different infections according to the mode of transmission
Figure 1. The curve shows the relation between the basic reproduction number and herd immunity threshold.
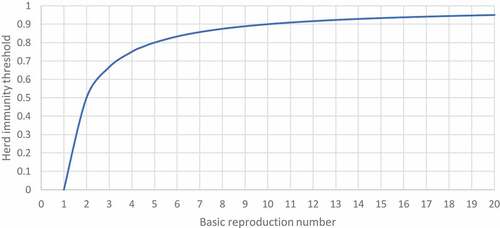
Figure 2. Herd immunity threshold (Ic) of the disease according to the basic reproduction number (R0).
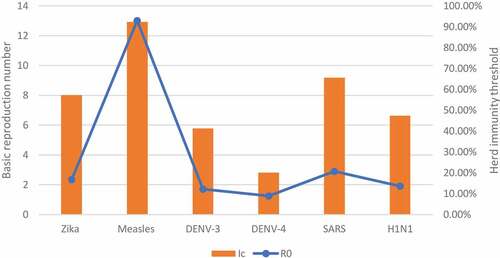
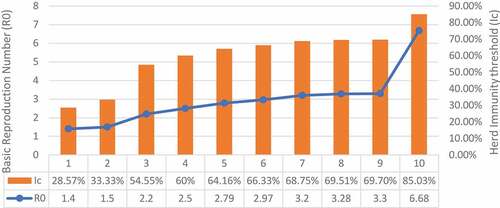
Figure 3. Herd immunity threshold (Ic) of COVID-19 depending on different values of the basic reproductive number (R0).