
Figures & data
Figure 1. Expression status of PD-L1 on TC-1 and MC38 cells, and the antitumor therapeutic effect of anti-PD-L1 Abs in association with gemcitabine. A) TC-1 cells (upper) and TC-1 cells from the tumor tissue (lower) were stained with PE-conjugated control IgG isotype (thin line) and PE-conjugated anti-PD-L1 Abs (thick line). The numbers in the left square indicate the mean fluorescence intensity (MFI) values of control Abs while those in the right square indicate the MFI values of anti-PD-L1 Abs. B,C) Each group of mice (n = 5/group) was challenged with TC-1 cells. When the tumor sizes became ≅ 2 mm in diameter, the mice were injected i.p. with 100 μg of anti-PD-L1 IgGs at 0, 3, 7, 10, and 13 days post-treatment. Tumor sizes were measured over the time points (B). On day 15, the mice were tested for in vivo CTL lytic activity (C). D) Similar experiments to Figure 1B except that when the tumor sizes become ≅ 5 mm in diameter, the mice were treated with anti-PD-L1 Abs and gemcitabine. In particular, the mice were injected i.p. with gemcitabine twice a week at a dose of 37.5 μg/g body weight. E) MC38 cells (upper) and MC38 cells from the tumor tissue (lower) were stained with PE-conjugated control IgG isotype (thin line) and PE-conjugated anti-PD-L1 Abs (thick line). The numbers in the left square indicate the MFI values of control Abs while those in the right square indicate the MFI values of anti-PD-L1 Abs. F) Similar experiments to Figure 1B except with MC38 cells. G) Similar experiments to Figure 1D except with MC38 cells. *p < .05 compared with non-treatment. #p < .05 compared with gemcitabine+control Ab
Figure 2. Expression status of PD-L1 on B16 cells, and the antitumor therapeutic effect of anti-PD-L1 Abs and role of immune cell subsets in antitumor immunity. A) B16 cells (upper) and B16 cells from the tumor tissue (lower) were stained with PE-conjugated control IgG isotype (thin line) and PE-conjugated anti-PD-L1 Abs (thick line). The numbers in the left square indicate the MFI values of control Abs while those in the right square indicate the MFI values of anti-PD-L1 Abs. B) Each group of mice (n = 5/group) was challenged with B16 cells. When the tumor sizes became ≅ 2 mm in mean diameter, the mice were injected i.p. with 100 μg of anti-PD-L1 Abs at 0, 3, 7, 10, and 13 days post-treatment. The tumor sizes were measured over the time points. The values and bars represent mean tumor sizes and SD, respectively. C) Similar experiments to Figure 2B except that the mice were injected with anti-PD-L1 Abs at 0, 3, 7, 10, and 13 days post-treatment. The mice were also injected with anti-CD4, anti-CD8, and anti-NK Abs at 0, 3, 7, 10 days post-treatment. *p < .05 compared with non-treatment. #p < .05 compared with anti-PD-L1
Figure 3. Populations of CD4+ and CD8 + T cells and NK cells in the tumor-draining lymph nodes (TDLNs) and tumor tissues. Each group (n = 5/group) of mice was challenged s.c. with B16 cells. When the tumor sizes became ≅ 2 mm in diameter, the mice were injected i.p. with 100 μg of anti-PD-L1 Abs at 0, 3, 7, 10, and 13 days post-treatment. At 15 days post-treatment, the mice were sacrificed, and TDLNs and tumor tissues were obtained. Immune cells of the TDLNs (5,500 CD45-positive cells) and tumor tissues (2,000 CD45-positive cells) were analyzed for the CD4+ and CD8 + T and NK cell populations
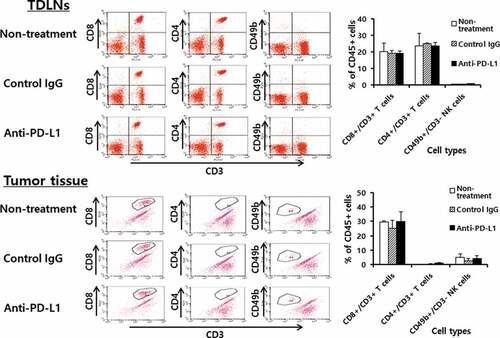
Figure 4. Populations of CD4+ and CD8 + T and NK cells in TC-1 and MC38 tumor tissues. Each group (n = 5/group) of mice was challenged s.c. with TC-1 and MC38 cells. When the tumor sizes became 8 mm, the mice were sacrificed, and the tumor tissues obtained. Immune cells (5,000 CD45-positive cells) of the tumor tissues were analyzed for the CD3+/CD8 + T cell, CD3+/CD4 + T cell, and CD3-/CD49b+ NK cell populations. *p < .05 compared with TC-1
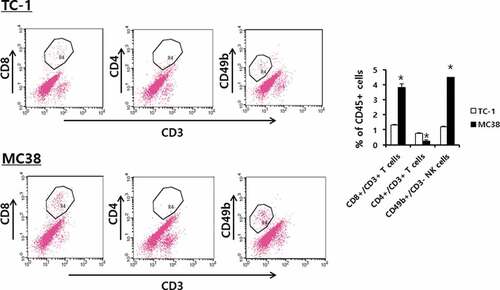
Figure 5. Immune cell responses to tumor antigens and melanoma class I peptides in tumor-bearing mice receiving anti-PD-L1 therapy. Each group (n = 5/group) of mice was challenged s.c. with B16 cells. (A) When the tumor sizes became ≅ 2 mm in diameter, the mice were injected i.p. with 100 μg of anti-PD-L1 Abs and control Abs at 0, 3, 7, 10, and 13 days post-treatment. At 15 days post-treatment, the mice were sacrificed, and the spleen was obtained. Six x 106 splenocytes per ml were stimulated with 2 × 10⁶ B16 cells along with TC-1 cells as a control that had been exposed to UV light for 1.5 h. Five μg of peptides per ml were also added to the splenocytes. After 2 days of stimulation, the cell supernatants were collected for measurement of IFN-γ. Values and bars represent IFN-γ concentrations and SD. (B) The splenocytes of the B16 tumor bearing mice (tumor size: 10 mm) were stimulated for 1 day with B16 cells and TC-1 cells as described in Figure 5A. In this case, 1 μM of monensin was added to the cell culture to block the secretion of IFN-γ. The immune cells (5,000 CD45-positive cells) were stained with anti-IFN-γ, along with each immune cell marker. (C) The percentages of CD4 + T cells, CD8 + T cells and CD49b+ NK cells among CD45+ cell populations. (D) The percentages of IFN-γ-positive cells among each population of CD4+ and CD8 + T cells, and NK cells. (E) The splenocytes were stimulated for 1 and 2 days with B16 cells and TC-1 cells, and the levels of IFN-γ were measured as described in Figure 5A, except without the addition of monensin. (F) The splenocytes were stimulated for 2 days with B16 cells, and the levels of IFN-γ were measured as described in Figure 5A. CD8 + T and NK cell-depleted (dep) immune cells were reacted with B16 cells in parallel with non-depleted (dep) whole immune cells. *p < .05 compared with TC-1. #p < .05 compared with non-dep. &p < .05 compared with CD8 + T cell dep or NK cell dep
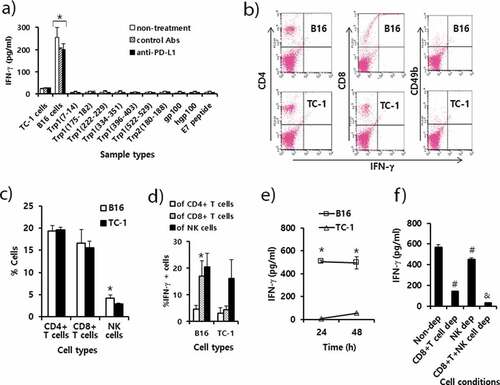
Figure 6. Preparation of peptide extracts from B16 cells and their fractionation by reversed-phase high performance liquid chromatography (RP-HPLC) and immunogenicity. (A) Peptides were extracted from B16 cells and desalted using the C18 Sep-Pak column, as described in “Materials and method.” The peptides were eluted with 3 ml of 60% acetonitrile (ACN) in water, of which 300 μl was vacuum-dried and then dissolved in 10% DMSO in PBS. The dissolved B16 cell elute was reacted with 6 × 10⁶ splenocytes from mice that had been immunized twice at 2-week intervals with Trp2 peptides plus CpG-ODN. Additionally, 10 μg of Trp2 peptides was dissolved in 3 ml of citrate-phosphate buffer, followed by passage through a C18 Sep-Pak column as described above. This sample was eluted with 3 ml of 60% ACN in water, of which 300 μl was dried and reacted with 6 × 10⁶ splenocytes from Trp2 peptide+CpG-ODN-immunized mice. For the IFN-γ control, 5 μg of Trp2 and E7 peptides were tested. (B) Negative control (E7 peptide), B16 cell elute, and 1 × 10⁶ of B16 and TC-1 cells were reacted with 6 × 10⁶ splenocytes from B16-bearing mice that had been treated with anti-PD-L1. After 2 days of incubation, the cell supernatants were collected for the IFN-γ assay. (C) Dried peptides from 1 ml of elute were dissolved in DMSO and fractionated by RP-HPLC, as described in “Materials and method.” The fractions displaying a high peak at 214 nm were selected and vacuum-dried. Blue line; peaks at 280 nm. (D) The dried fraction samples were re-suspended in 10% DMSO in water and stimulated for 3 days with 6 × 10⁶ splenocytes from B16 tumor-bearing mice. The cell supernatants were measured for IFN-γ levels. Arrows indicate the fraction number displaying the highest levels of IFN-γ production among the tested samples. *p < .05 compared with naïve control. #p < .05 compared with E7 peptide
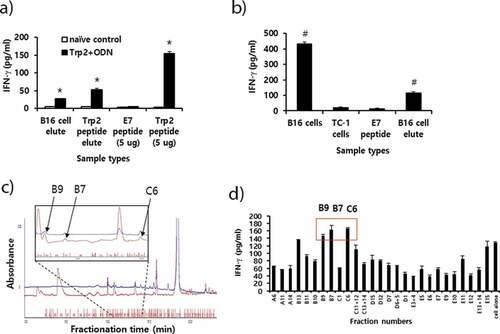
Figure 7. The antitumor activity of anti-PD-L1 Ab treatment in combination with combination therapy using Trp2 peptide vaccines. (A) Each group of mice (n = 5/group) was challenged s.c. with B16 cells. When the tumor sizes became 1.5 mm (A,B) and 3 mm (C) in mean diameter, the mice were injected i.p. with 100 μg of anti-PD-L1 Abs at 0, 3, 7, 10, and 13 days post-treatment. The mice were also treated s.c. with Trp2 peptides plus CpG-ODN at 0 and 7 days post-treatment, as described in “Material and methods”. The tumor sizes were measured over the time points. The values and bars represent mean tumor sizes (A,C) and %complete tumor regression rates (B) and SD, respectively. *p < .05 compared with non-treatment. &p < .05 compared with anti-PD-L1. #p < .05 compared with anti-PD-L1 and Trp2+ ODN+control Ab
Supplemental Material
Download TIFF Image (133 KB)Data Availability Statement
The datasets generated during and/or analyzed during the current study are available from the corresponding author on reasonable request.