
Figures & data
Figure 1. Changes in recommended mumps vaccine schedule in Ontario, Canada.
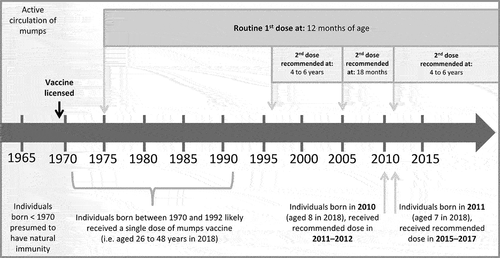
Table 1. Population characteristics of Communities A and B at the start of the outbreak, crude attack rates, and unadjusted hazard ratios
Figure 2. [Panel A] Epi-curve for the 70 confirmed and probable cases of mumps occurring in Communities A and B: Dec 18, 2017, to June 27, 2018. [Panel B]: MMR vaccine doses administered in Communities A and B: Dec 18, 2017, to Jun 27, 2018.
![Figure 2. [Panel A] Epi-curve for the 70 confirmed and probable cases of mumps occurring in Communities A and B: Dec 18, 2017, to June 27, 2018. [Panel B]: MMR vaccine doses administered in Communities A and B: Dec 18, 2017, to Jun 27, 2018.](/cms/asset/59a4cc37-3dc9-44de-8023-53a8f29f987f/khvi_a_1870909_f0002_b.gif)
Table 2. Unadjusted and adjusted hazard ratios for becoming a case of mumps among residents eligible to receive mumps vaccine (aged ≥1 year) during the outbreak, 18-Dec-2017 to 27-June-2018
Supplemental material