
Figures & data
Table 1. Characteristics of the two study groups at baseline
Figure 1. Proportion (%) of study participants in the vaccine and disease groups without circulating anti-measles IgG at study enrollment
p<0.0001.
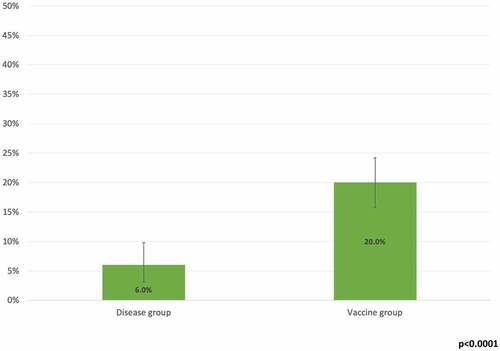
Table 2. Multivariate logistic regression analysis of the determinants of seropositivity at enrollment
Figure 2. Kaplan-Meier PAS estimates for the vaccine and disease groups
p<0.0001.
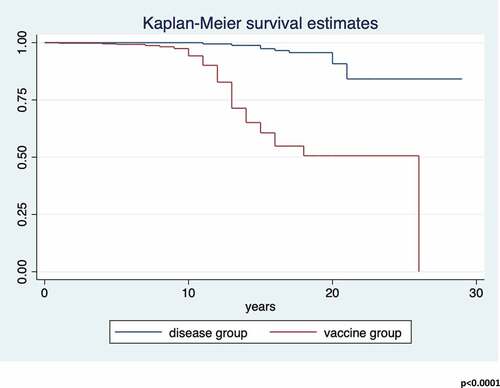
Table 3. Multivariate cox semiparametric regression analysis of the risk predictors of PAS