
Figures & data
Figure 1. Characterization of particle size and aggregation potential of VLP/PP formulations. (A, B) DLS profiles of VLPs, PPs, and formulations of VLPs with PCEP (A) and PCPP (B) at 1:2.5 (w/w) ratio (PBS, pH 7.4); (C) z-average hydrodynamic diameter of VLPs-PCPP and VLPs-PCEP versus ratio of formulation components. (D) Schematics of suggested mechanisms of interactions between VLPs and polymers is also shown (0.05 mg/mL VLPs, PBS, pH 7.4)
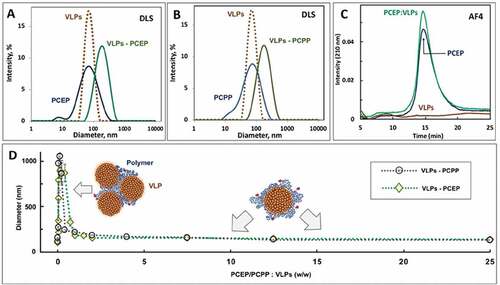
Figure 2. Physicochemical analysis of VLP-PP formulations. (A) Change in z-average hydrodynamic diameter of PCPP-VLP and PCEP-VLP formulations versus time (D0 – diameter at 0 h; PBS, pH 7.4, 4°C, 0.5 mg/mL PCPP or PCEP, 0.02 mg/mL VLPs); (B) endosomolytic activity of PCEP-VLP and PCEP-VLP formulations as assessed by their hemolytic activity at various pH (red blood cells, 0.025 mg/mL polymer concentration, 10 mM phosphate buffer, 0.9% sodium chloride)
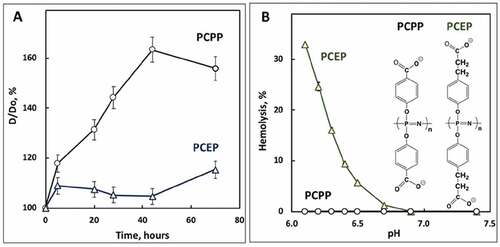
Figure 3. Enhancement of RG1-VLP-specific humoral immunity in the presence of PP adjuvant formulations. Mice were immunized i.m. with 2 µg RG1-VLP alone or adjuvanted with 50 µg alum, 25 or 50 µg PCPP, 25 or 50 µg PCEP or Gardasil-9 on days 0, 21, 42 and peripheral blood sera samples derived on day 56. (A-B) Sera samples were tested for HPV16-L1- and HPV16-L2 RG1-specific IgG via ELISA. (C-F) Sera samples were analyzed for neutralizing titers via fc-PBNA specific for PsV16-, PsV18-, PsV39-, PsV6-SEAP. Data are reported as geometric means ± 95% confidence interval (CI). Statistical comparisons are between VLPs alone and all groups or between alum and all groups (upper tier for A and C) and were generated using one-way ANOVA nonparametric analysis with the Kruskal-Wallis multiple comparisons test. ns, not significant (p > .05); *, p < .05; **, p < .01; ***, p < .001; ****, p < .0001
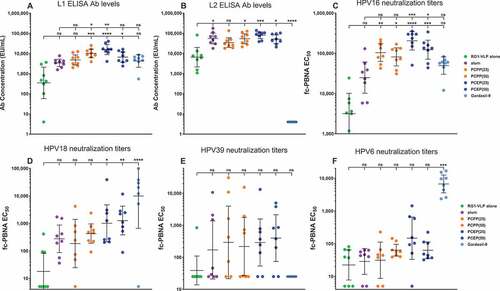
Figure 4. PCEP adjuvant formulations allow for dose-sparing of VLPs and PCEP. Mice were immunized i.m. with 0.5–2.0 µg RG1-VLP alone or adjuvanted with 50 µg alum, 7.5 or 15 µg PCEP, or Gardasil-9 on days 0, 14, 28 and peripheral blood sera samples derived on day 42. (A-B) Sera samples were tested for HPV16-L1- and HPV16-L2 RG1-specific IgG via ELISA. (C-F) Sera samples were analyzed for neutralizing titers via fc-PBNA specific for PsV16-, PsV18-, PsV39-, PsV6-SEAP. (F) Numbers of responding mice with detectable titers of PsV6-neutralizing activity are indicated. Data are reported as geometric means ± 95% CI. Statistical comparisons are between VLPs alone and all groups or between alum and all groups (upper tier for C) and were generated using one-way ANOVA nonparametric analysis with the Kruskal-Wallis multiple comparisons test. ns, not significant (p > .05); *, p < .05; **, p < .01; ***, p < .001; ****, p < .0001
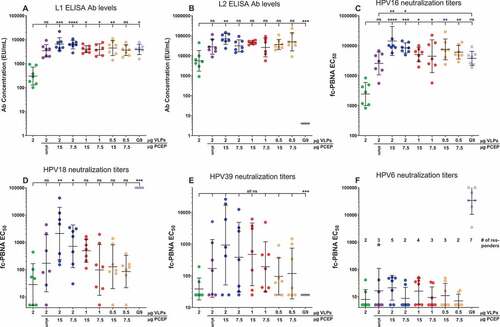
Figure 5. PCEP accelerates the appearance of L1/L2 Ab levels as well as HPV16/18-neutralization titers. Mice were immunized i.m. with 0.5–2.0 µg RG1-VLP alone or adjuvanted with 50 µg alum, 7.5 or 15 µg PCEP, or Gardasil-9 on days 0, 14, 28 and peripheral blood sera samples derived on days 28, 42. (A-B) Sera samples were tested for HPV16-L1- and HPV16-L2 RG1-specific IgG via ELISA. Statistical comparisons are between VLPs alone and adjuvanted groups for each time point; absence of designation indications no statistical difference. (C-D) Day 28 sera samples were analyzed for neutralizing titers via fc-PBNA specific for PsV16-, PsV18-SEAP. Data are reported as geometric means ± 95% CI. Statistical comparisons are between VLPs alone and adjuvanted groups, or between alum and PCEP groups (upper tier in C) and were generated using one-way ANOVA nonparametric analysis with the Kruskal-Wallis multiple comparisons test. ns, not significant (p > .05); *, p < .05; **, p < .01; ***, p < .001
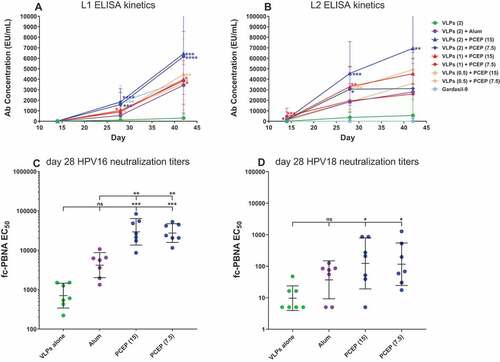
Figure 6. PCEP promotes a sustained elevation of the L1 and L2 Ab response over several months. Mice were immunized i.m. with 2 µg RG1-VLP alone or adjuvanted with 50 µg alum, or 15 or 50 µg PCEP, or Gardasil-9 on days 0, 14, 28 and peripheral blood sera samples derived on days 42, 70, 98, 125. (A-B) Sera samples were tested for HPV16-L1- and HPV16-L2-specific IgG via ELISA. Data are reported as geometric means ± 95% CI. Statistical comparisons were generated using nonparametric Mann-Whitney t-test. p > .05; *, p < .05; **, p < 001
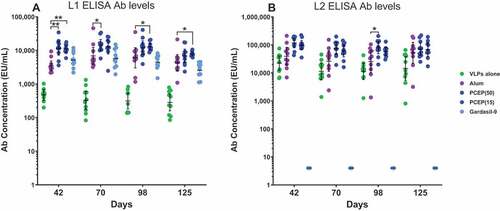
Figure 7. Vaccination with PCEP-adjuvanted VLPs provides protection against HPV39 inoculation. Mice were immunized i.m. with 2 µg RG1-VLPs alone or adjuvanted with 50 µg alum or 50 µg PCEP, or with Gardasil-9, or with no treatment (no Tx) on days 0, 14, 28. On day 39, mice were intravaginally inoculated with PsV16-Luc or PsV39-Luc, and 3 days later, luciferin was applied topically to the site of inoculation. 2D bioluminescent images were captured and signal quantitated. (A) Bioluminescent values were plotted individually with geomeans ± 95% CI. Statistical comparisons are between no Tx and vaccinated groups and were generated using one-way ANOVA nonparametric analysis with the Kruskal-Wallis multiple comparisons test. *, p < .05; **, p < .01; ***, p < .001, ****, p < .0001. (B) Bioluminescent signal is imaged for all mice with ROIs drawn over the ventral vaginal area and over the ventral thoracic area for background signal
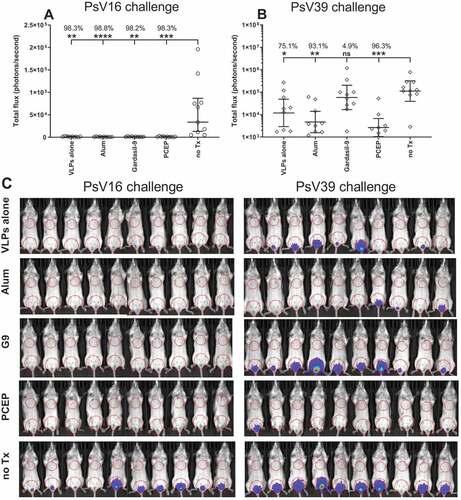
Figure 8. Elevated IgG2a titers induced by adjuvanting with PCEP. Mice were immunized i.m. with 2.0 µg RG1-VLPs alone or adjuvanted with 50 µg alum (Alhydrogel), 50 or 15 µg PCEP, or Gardasil-9 on days 0, 14, 28 and peripheral blood sera samples were derived on day 42. (A-B) Sera samples were tested for HPV16-L1- and HPV16-L2 RG1-specific IgG2a via ELISA. Data are reported as geometric means ± 95% CI. Statistical comparisons are between VLPs alone and adjuvanted groups (lower tier), or between alum and PCEP groups (upper tier) and were generated using one-way ANOVA nonparametric analysis with the Kruskal-Wallis multiple comparisons test. ns, not significant (p > .05); **, p < .01; ***, p < .001; ****, p < .0001
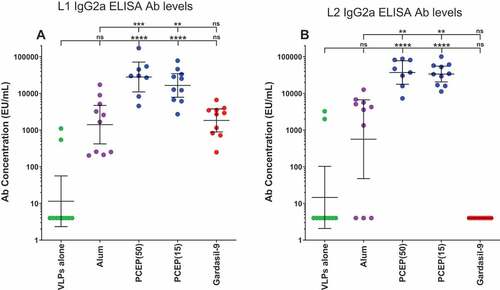
Table 1. L2 RG1 epitope sequences compared between HPV types. The amino acid sequences at positions 20–31 of L2 capsid for HPV16/18/39/6 were analyzed by BLOSUM62 comparison matrix for alignment