Figures & data
Table 1. Overview of vaccination strategies used to model cost-effectiveness
Figure 1. Illustration of time at risk of IMD, MCV4 vaccination uptake and duration of protection from MCV4 in all cohorts studied

Figure 2. Markov model simulating the impact of vaccinating teenagers with MCV4
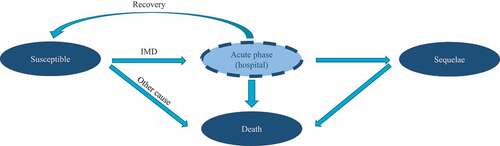
Table 2. Model input parameters
Table 3. Costs and health gains of vaccination with one dose of MCV4. Estimates are displayed per birth cohort. Current practice refers to today’s practice of vaccinating 18-year-olds outside a NIP setting (48% uptake, retail vaccine price) and is therefore the base case strategy in the model. Universal 15 and Universal 18 refers to vaccination in a NIP setting (90% uptake, 50% rebate on vaccine price) of 15-year-olds and 18-year-olds, respectively. Estimates for the Universal 15 or Universal 18 strategies are the results of comparing these strategies individually with the base case strategy Current practice.
Figure 3. Scatterplot of simulations comparing the strategy Universal 15 with Current practice. Dotted red line represents the threshold for displaced health interventions of €35,000 per QALY and dashed blue line the willingness-to-pay threshold of €86,000 per QALY
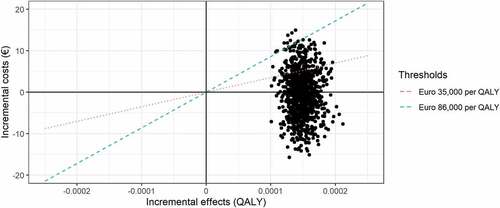
Figure 4. Cost-effectiveness acceptability curve comparing the strategy Universal 15 (yellow line) with Current practice (green line). Dotted purple line represents threshold for displaced health interventions of €35,000 per QALY and dashed blue line the willingness-to-pay threshold of €86,000 per QALY
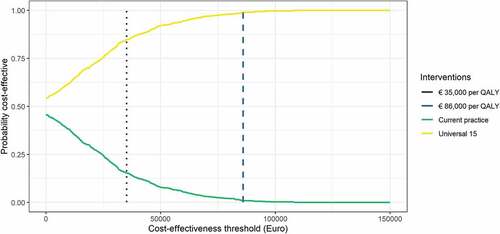
Figure 5. Tornado diagram of one-way sensitivity analysis on selected inputs with strategies Universal 15 compared to Current practice. Red indicates the lower boundaries and blue the upper boundaries for sensitivity analyses of input parameters in the model. Dotted line represents the threshold for displaced health interventions of €35,000 per QALY and dashed line the willingness-to-pay threshold of €86,000 per QALY. Black solid line represents input parameters used for base case cost-effectiveness calculations in the strategy Universal 15 (50% vaccine rebate, 90% vaccine uptake, medium IMD incidence and 2–4% discount rate)
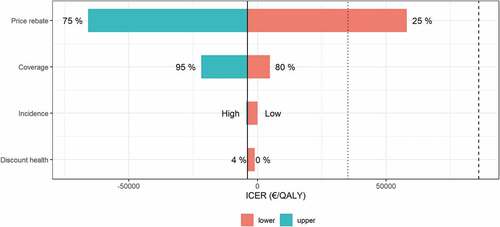
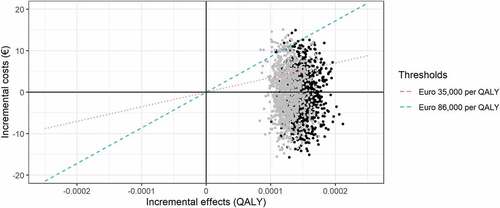
Figure 6. Scatterplot of simulations for comparing the strategies Universal 15 and Current practice (black dots) versus comparing Universal 18 and Current practice (gray dots). Dotted red line represents the threshold for displaced health interventions of €35,000 per QALY and dashed blue line the willingness-to-pay threshold of €86,000 per QALY