
Figures & data
Figure 1. Participant disposition.
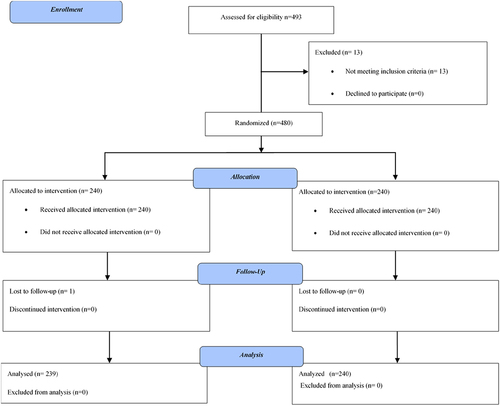
Table 1. Demographics and baseline characteristics of participants
Table 2. Geometric mean hemagglutination inhibition (HI) Titer by strain and geometric mean fold increase in HI titer by strain
Table 3. Seroprotection and seroconversion rates based on hemagglutination inhibition titer by strain
Figure 2. Reverse cumulative distribution (RCD) curves.
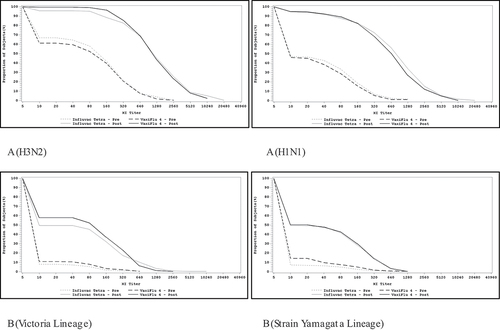
Table 4. Overall summary of adverse events
Table 5. Summary of treatment emergent adverse events
Supplemental material