Figures & data
Figure 1. Outline of the FFA and RT-qPCR in vitro potency assays and correlations of RV3-BB stability results as measured by both assays. Panel (a) shows outline of the in vitro potency assays for determining RV3-BB log titers. The infectious titer (Log FFU/ml) and titer loss (log loss vs. unstressed control) values were measured by RT-qPCR assay and FFA after RV3-BB virus (in DMEM medium) was subjected to (b) Thermal stress at 37°C for up to 72 h, and (c) pH stress at 5.5 to 8.0 at 37°C for 2 h with 20 mM citrate phosphate buffer. Panels (d) and (e) display correlation plots of RV3-BB stability as measured by both in vitro potency assays for the thermally-stressed and pH-stressed virus samples, respectively. Data are presented as the mean ± SD (n = 3)
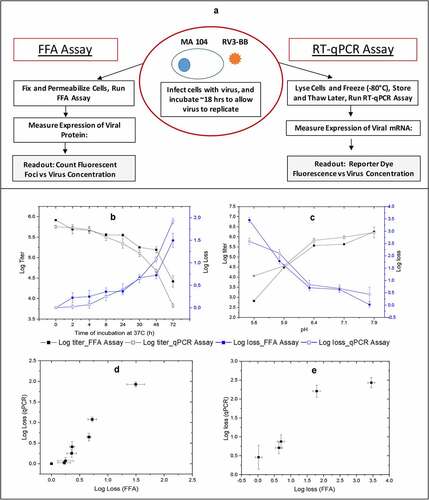
Figure 2. Effect of freeze-thaw on RV3-BB stability in the presence of different excipients as measured by RT-qPCR. (a) Excipients listed in order of protective effect on RV3-BB stability, and (b) Excipients listed by class of additives. Titer losses in individual control formulations (stored at −80⁰C) were calculated with respect to RV3-BB in a no excipient control sample (sodium phosphate buffer at pH 7.0) stored under same conditions to measure the effect of freeze-thaw on RV3-BB stability. The virus log loss titer data are presented as the mean ± SD (n = 3)
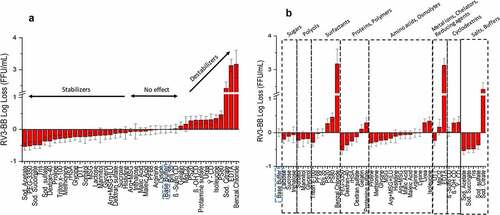
Figure 3. Effect of elevated temperature on RV3-BB stability in the presence of different excipients as measured by RT-qPCR. (a) Excipients listed in order of protective effect on RV3-BB stability, and (b) Excipients listed by class of additives. Loss in viral titers due to thermal stress (3 days in a glass vials at 25°C) was calculated with respect to control samples that were stored at −80°C (prepared with the same excipient in a sodium phosphate buffer, pH 7.0). Excipients showing complete titer loss are indicated by asterisk (*). The virus log loss titer data are presented as the mean ± SD (n = 3)
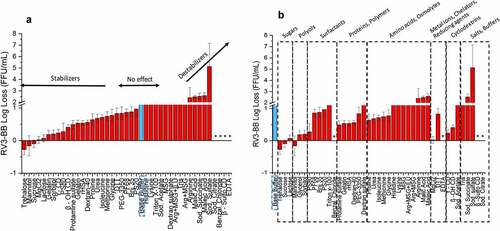
Figure 4. Effect of agitation stress on RV3-BB stability in the presence of different excipients as measured by RT-qPCR. (a) Excipients listed in order of protective effect on RV3-BB stability, and (b) Excipients listed by class of additives. Loss in viral titer due to agitation (300 rpm for 24 h at 25⁰ C) were calculated with respect to the control samples that were stored at 25°C (prepared with the same excipient in a sodium phosphate buffer, pH 7.0), and incubated for the same amount of time without agitation. The virus log loss titer data are presented as the mean ± SD (n = 3)
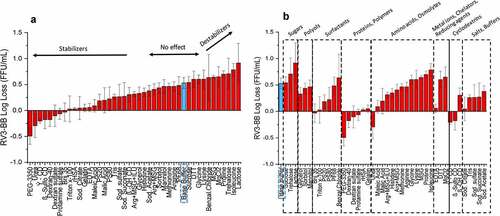
Figure 5. Effect of concentrations of stabilizers on RV3-BB stability during exposure to elevated temperatures and agitation as measured by RT-qPCR. (a) Titration studies of sucrose, trehalose and sorbitol concentration on RV3-BB stability at 25°C for 1 week (at indicated concentration of each additive in a phosphate buffer, pH 7.0). RV3-BB viral titer losses due to thermal stress were calculated with respect to control samples that were stored at −80°C and prepared in the same excipient/base buffer. (b) Titration studies of PEG-3350 concentrations (0 to 1% w/v) on RV3-BB stability upon agitation (300 rpm for 1, 3 and 5 days at 25⁰ C). RV3-BB samples contained 400 mM succinate and 50% (w/v) sucrose in a phosphate buffer at pH 7.8. RV3-BB viral titer losses due to agitation were calculated with respect to their corresponding control samples (incubated for the same amount of time at 25°C without agitation). The virus titer data are presented as the mean ± SD (n = 4)
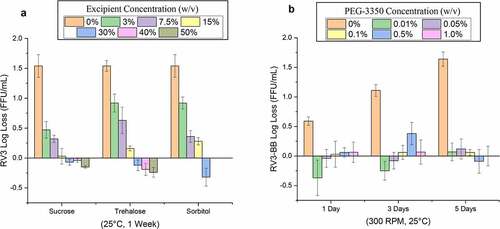
Figure 6. Effect of selected high buffering capacity excipients on RV3-BB stability during exposure to elevated temperatures and acidic pH conditions as measured by RT-qPCR. (a) Log loss RV3-BB viral titers after 1 week at 25°C in formulations containing indicated levels of either succinate, acetate, malate, adipate or citrate (in a phosphate buffer, pH 7.0 containing 30% sucrose). (b) Log loss RV3-BB viral titers after addition of 4 mL 0.1 N HCl (at 37°C for 1 hr.) to RV3-BB formulations containing indicated levels of either succinate, acetate, malate, adipate or citrate (in a phosphate buffer, pH 7.5 containing 50% sucrose). The virus log loss titer data are presented as the mean ± SD (n = 3)
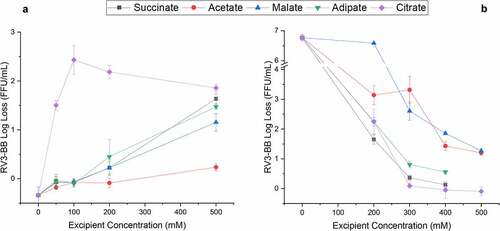
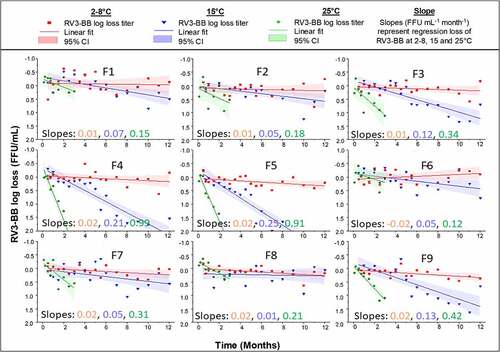
Table 1. Candidate RV3-BB liquid formulations evaluated during accelerated and long-term stability at -20, 2–8, 15, 25°C. A summary of the stability results is also provided in terms or slope of log loss/month of RV3-BB titers at various temperatures. See for corresponding stability data
Figure 7. Real-time and accelerate storage stability study of RV3-BB in candidate liquid formulations (F1-F9) over 12 months at 2–8 C, 15 and 25⁰C as measured by RT-qPCR. Composition of each RV3-BB candidate formulation (F1-F9) is shown in Table 1. Solid lines (slopes with units FFU mL-1 month-1) represent regression of mean log loss of RV3-BB viral titer at different temperatures vs. −80⁰C control formulation. Shaded bands represent 95% CI of the regression line accounting for assay variability. The virus log loss titer data are presented as the mean ± SD (n = 4)