Figures & data
Figure 1. Flow chart of included publications on COVID-19 vaccine
Table 1. Top-10 most prolific authors
Table 2. Distribution of included publications by document type
Table 3. Top-10 active institutions
Table 4. Top-10 leading journals
Table 5. Top-10 frequently used words
Table 6. Top-10 most productive countries in COVID-19 vaccine
Figure 2. Co-authorship country visualization network map. Only five clusters are formed; red color indicates Cluster 1 (11 countries: Austria, Belgium, England, Finland, France, Germany, Italy, Netherland, Scotland, Sweden, and Turkey); green color indicates Cluster 2 (10 countries: Chile, Denmark, Greece, Romania, Russia, Singapore, South Korea, Switzerland, and Thailand); blue color indicates Cluster 3 (9 countries: Bangladesh, Colombia, Egypt, India, Indonesia, Malaysia, Morocco, Pakistan, and Saudi Arabia); yellow color indicates Cluster 3 (8 countries: Canada, Israel, Japan, New Zealand, Nigeria, South Africa, Spain, and Taiwan); purple color indicates cluster 5 (6 countries: Australia, Brazil, Mexico, Norway, China, and USA)
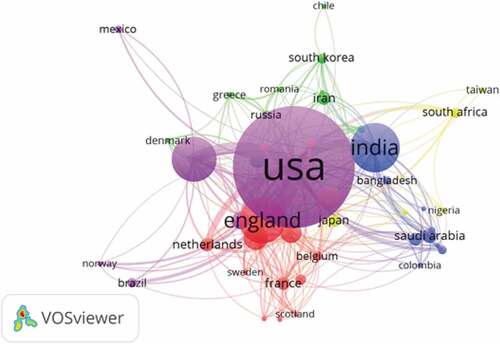
Figure 3. Visualization network map of author keywords co-occurrence. There are nine Clusters are formed weights based on occurrences. Red color represents Cluster 1 (14 words), green color represents Cluster 2 (11 words), blue color represents Cluster 3 (9 words), yellow color represents Cluster 4 (7 words), purple color represents Cluster 5 (6 words), light-blue represents Cluster 6 (5 words), orange color represents Cluster 7 (5 words), black color represents Cluster 8 (3 words), and pink color represents Cluster 9 (1 word)
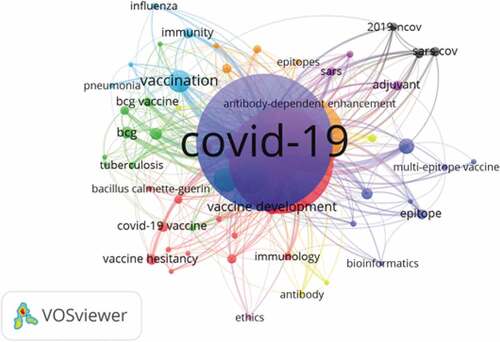
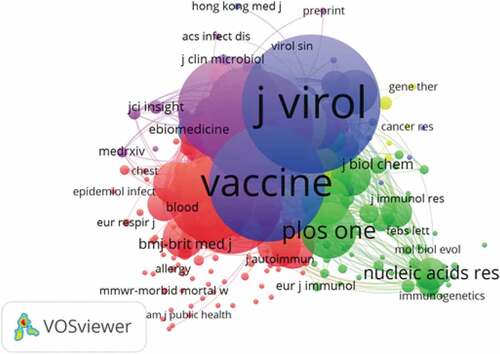
Figure 4. Visualization mapping of co-citation cited sources. There are five clusters formed; red color indicates cluster 1 (90 sources), green color indicates cluster 2 (57 sources), blue color indicates cluster 3 (31 sources), yellow color represents cluster 4 (21 sources), and purple color represents cluster 5 (18 sources)