
Figures & data
Figure 1. Trial design
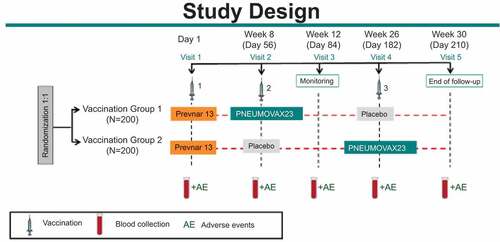
Table 1. Participant demographics
Figure 2. Participant disposition. Group #1 = PCV13 -> PPSV23 -> Placebo. Group #2 = PCV13 -> Placebo -> PPSV23. PPSV23 = 23-valent pneumococcal polysaccharide vaccine. PCV13 = 13-valent pneumococcal conjugate vaccine
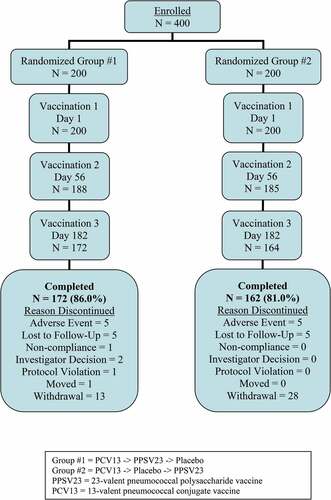
Table 2. Summary of adverse events (AEs) occurring on Days 1–14 after any vaccination (all subjects as treated)
Table 3. Listing of most frequently reported adverse events (>5% in either group)
Table 4. Summary of OPA GMTs measured
Table 5. Analysis of postvaccination OPA GMTs to pneumococcal serotypes at week 12 (per protocol population)
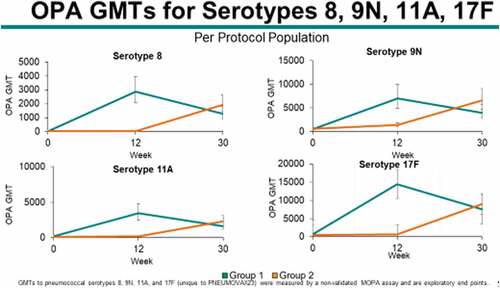
Figure 3a. Summary of OPA GMTs measured at baseline, weeks 8, 12, 26, and 30 (per protocol population)
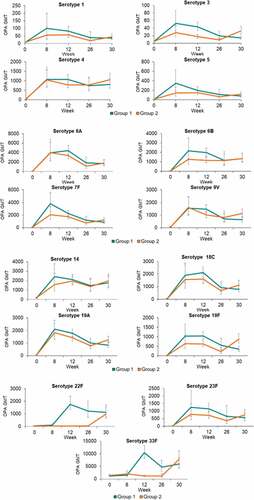
Figure 3b. (Continued)
Supplemental material