
Figures & data
Table 1. Basic sequencing data for 4 volunteers pre-vaccination and post-vaccination
Figure 1. The diversity of repertoires of TCRBV before and after immunization with RABV vaccines in 4 volunteers. The volunteers were injected with anti-RABV vaccines for three times and TCR repertoires were detected by high throughput sequencing. The comparison of most frequent TCRBV before and after RABV vaccination was shown
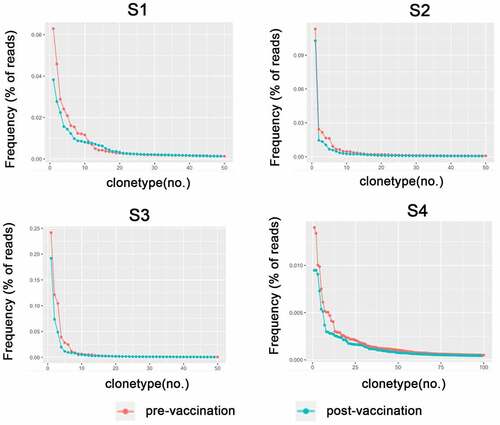
Figure 2. Unique clonotypes in different degree of expansion in 4 volunteers before and after RABV vaccination. The clonotypes before and after vaccination were calculated and divided into five levels according to their frequencies
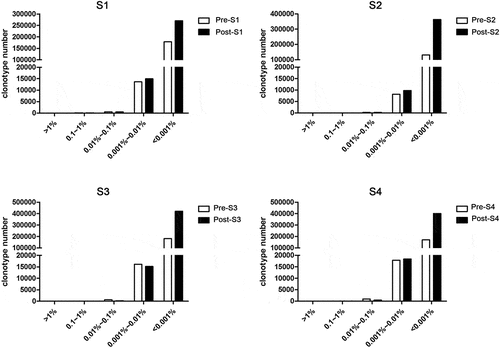
Figure 3. TCRBV diversity in 4 volunteers before and after RABV vaccination. The TCRBV diversity were evaluated by Shannon method
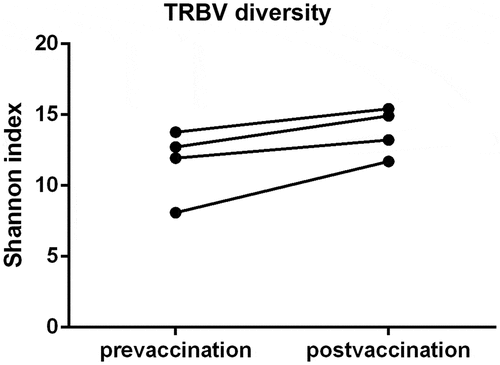
Figure 4. The usage frequencies of TRBV and TRBJ gene segments in 4 volunteers before and after RABV vaccination. (a) Frequency of TRBV segments before and after RABV vaccination. (b) Frequency of TRBJ segments before and after RABV vaccination
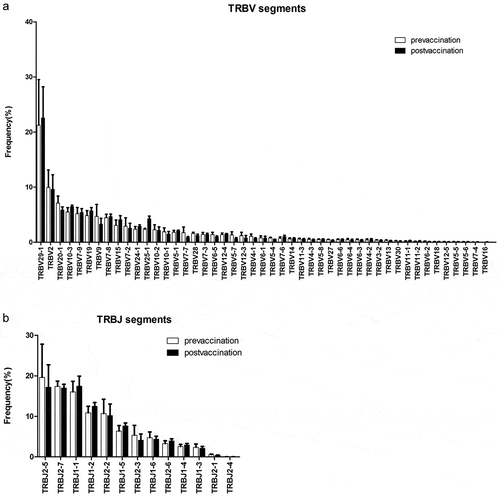
Figure 5. The usage frequencies of all possible distinct functional V-J pairing in 4 volunteers before and after RABV vaccination. The x axis represents all functional V genes and the y axis represents all functional J genes. The height of the bars is proportional to the frequency of a V-J pairing
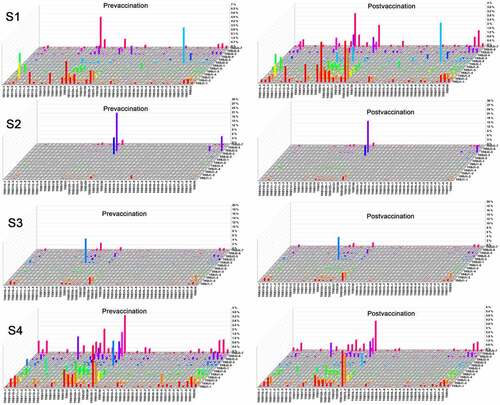
Table 2. The overlap in the repertoires of TCRB CDR3 before and after immunization with RABV vaccines in 4 volunteers
Table 3. The top 20 high-frequency clonotypes before and after RABV vaccination