
Figures & data
Figure 1. Who-Acquired-Infection-From-Whom matrices (a) and age-specific VZV seroprevalence data with model prediction and corresponding age-specific force of infection (b)
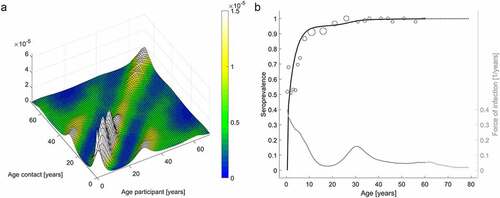
Figure 2. Changes in critical vaccine coverage according to changes in varicella primary vaccine failure for the estimated basic reproductive number () of the base case (a) and those of all sensitivity analyses (b)
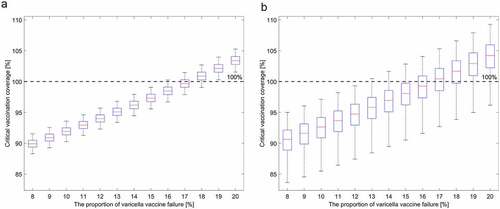
Table 1. Estimated proportionality factor () and basic reproductive number (
) for varicella with the 95% confidence interval as a result of the sensitivity analysis. The proportionality factor for physical contact matrix is represented as
, and the one for nonphysical contact matrix is done as
. Cases were varied by data and methods: contact survey data, varicella seroprevalence, and approaches to generate the WAIFW matrices