
Figures & data
Figure 1. Plain language summary
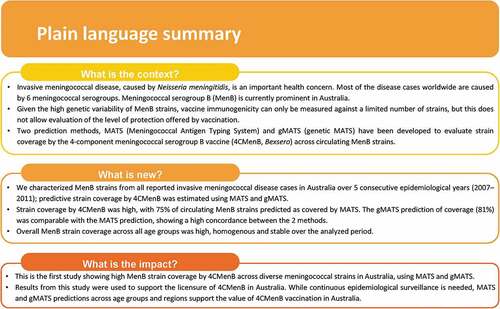
Figure 2. Clonal complexes distribution in the 520-strain panel, by year and overall
NA, genotyping data not available; ST, sequence type; CC, clonal complex; ET, electrophoretic type; N, number of isolates.
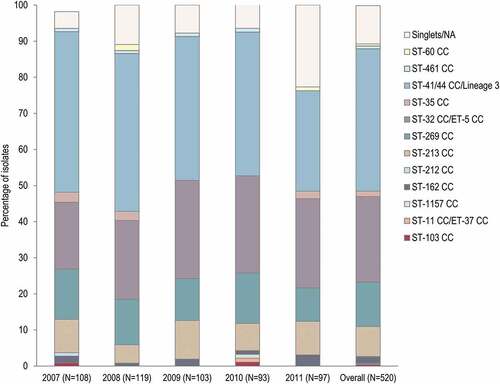
Figure 3. 4CMenB peptides and subvariants and their distribution in the 520-strain panel
4CMenB, 4-component meningococcal serogroup B vaccine; fHbp, factor H binding protein; NHBA, neisserial heparin binding antigen; nadA, Neisseria adhesin A; PorA, porin A; VR, variable region.Notes: the labels above the bars indicate the number and percentage of strains with the same genotype feature. * Only peptides/profiles detected in ≥2% of isolates are shown.
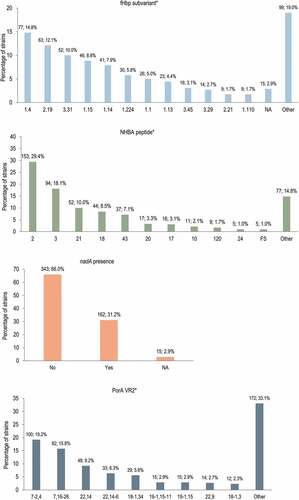
Table 1. Strain coverage predicted by MATS and gMATS, overall and by year of sample collection, state/territory, and the patient’s age group
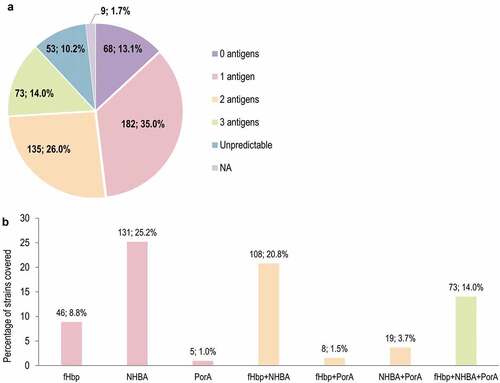
Figure 4. Number and percentage of MenB strains from the 520-strain panel covered in MATS, by number of 4CMenB vaccine antigens (a) and vaccine antigen/combination of antigens (b)
MenB, meningococcal serogroup B; MATS, meningococcal antigen typing system; 4CMenB, 4-component MenB vaccine; fHbp, factor H binding protein; NHBA, neisserial heparin binding antigen; NadA, Neisseria adhesin A; PorA, porin A. Note: the labels above the bars indicate the number and percentage of covered strains.
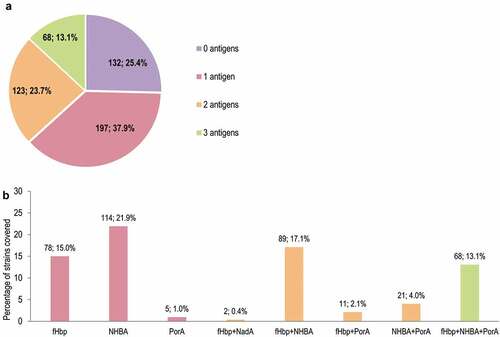
Figure 5. Number and percentage of MenB strains from the 520-strain panel covered in gMATS, by number of 4CMenB vaccine antigens (a) and vaccine antigen/combination of antigens (b)
MenB, meningococcal serogroup B; gMATS, genetic meningococcal antigen typing system; 4CMenB, 4-component MenB vaccine; NA, genotyping data not available; fHbp, factor H binding protein; NHBA, neisserial heparin binding antigen; PorA, porin A. Note: the labels above the bars indicate the number and percentage of covered strains.
Supplemental material