Figures & data
Figure 1. COVID-19 deaths/million negatively correlates with Flu deaths at all three time points studied: Correlation of Flu deaths/100,000 was performed of countries for three different time points: 17th May 2020 (a), 1st October 2020 (b) and 31st December 2020 (c) with respect to COVID-19 deaths/million. The graphs have been correlated and the Spearman’s correlation coefficient value (Rs) has been calculated along with the respective p values. Correlation has been considered statistically significant if p < .1
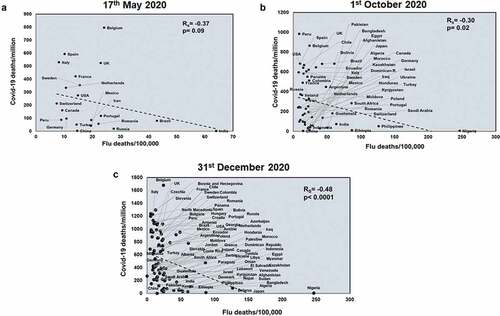
Figure 2. COVID-19 deaths/million negatively correlates with TB incidences at all three time points studied: Correlation of TB incidences was performed for countries at three different time points: 17th May 2020 (a), 1st October 2020 (b) and 31st December 2020 (c) with respect to COVID-19 deaths/million. The graphs have been correlated and the Spearman’s correlation coefficient value (Rs) was calculated along with the respective p values. Correlation has been considered statistically significant if p < .1
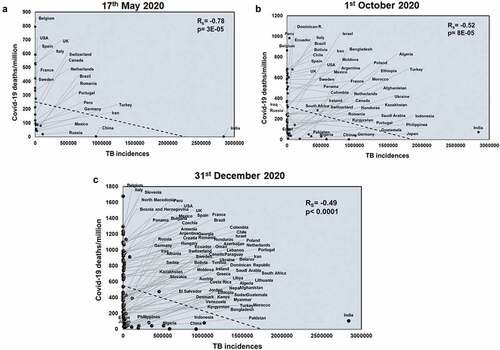
Figure 3. TB deaths correlates with COVID-19 deaths/million negatively at all three time points studied: Correlation of deaths/100,000 due to TB was performed for countries at three different time points: 17th May 2020 (a), 1st October 2020 (b) and 31st December 2020 (c) with respect to COVID-19 deaths/million. The graphs have been correlated and the Spearman’s correlation coefficient value (Rs) and the respective p values have been mentioned. Correlation has been considered statistically significant if p < .1
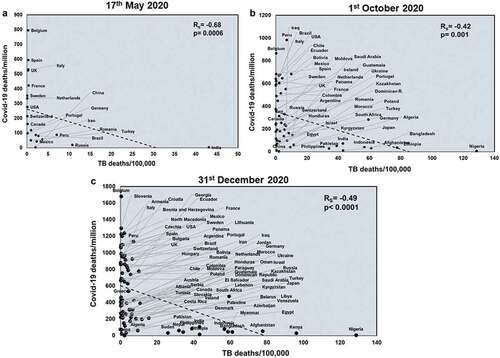
Figure 4. Countries having low TB and Flu deaths display the highest COVID-19 deaths/million: Countries were grouped based on the extent of Flu and TB deaths/100,000 and analyzed for COVID-19 deaths/million. The countries were divided into three groups by keeping a cutoff in which countries having >25 deaths/100,000 were considered as high deaths and denoted as ‘hi’ whereas countries having <25 deaths/100,000 were denoted as ‘lo’. The three groups were analyzed for mean differences at three different time points: (a). 17th May 2020, (b). 1st October 2020 and (c). 31st December 2020. One-way ANOVA was used to calculate the statistical significance, *p < .05
Figure 5. COVID-19 deaths/million positively correlates significantly with Flu vaccination coverage at all three time points studied: Correlation of Flu vaccination coverage was performed for countries at three time points: 17th May 2020 (a), 1st October 2020 (b) and 31st December 2020 (c) with respect to COVID-19 deaths/million. The graphs have been correlated and the Spearman’s correlation coefficient value (Rs) was calculated along with the respective p values. Correlation has been considered statistically significant if p < .1
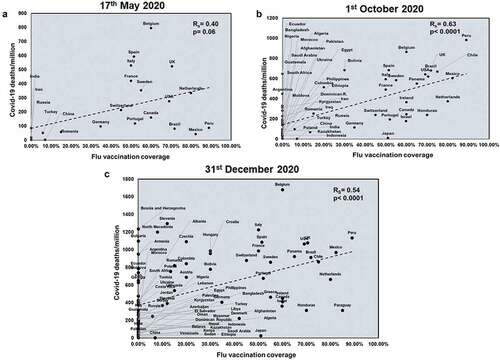
Figure 6. BCG coverage negatively correlates with COVID-19 deaths/million at all three time points studied: BCG coverage was correlated for countries at three different time points: 17th May 2020 (a), 1st October 2020 (b) and 31st December 2020 (c) with respect to COVID-19 deaths/million. Spearman’s correlation coefficient value (Rs) and the respective p values have been mentioned for each graph. Correlation has been considered statistically significant if p < .1
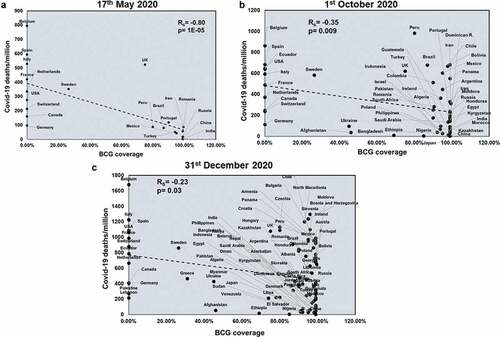
Figure 7. Countries belonging to the group of BCG+FluVac− display the lowest COVID-19 deaths/million and the most delayed transmission of infection: Countries were grouped based on the coverage of BCG and flu vaccination and analyzed for COVID-19 deaths/million and COVID-19 mortality rate. These vast majority of countries were divided into four groups firstly based on the availability or non-availability of BCG or flu vaccination, designated with ‘+’ and ‘-‘ respectively. Next, the groups were further classified based on the extent of coverage of a particular vaccination. Countries with >50% coverage of a particular vaccination were considered having high vaccination and denoted with ‘hi’ whereas countries with <50% coverage were considered having low vaccination coverage and thus denoted ‘lo’. The four major groups were analyzed for mean differences at three different time points: (a). 17th May 2020, (b). 1st October 2020. and (c). 31st December 2020. (d). The major groups out of 83 countries were also compared with respect to the time required for the first 10,000 cases to occur. One-way ANOVA was used to calculate the statistical significance, *p < .05 **p < .01, ***p < .001 and ****p < .0001
Figure 8. Countries with high BCG and high TB deaths show the lowest COVID-19 deaths/million: Countries with BCG coverage and TB deaths were further classified based on the extent of vaccine coverage and deaths/100,000. The two major groups were: BCGhiTBhi and BCGhiTBlo. The data was plotted based on COVID-19 deaths/million for (a). 17th May 2020, (b). 1st October 2020 and (c). 31st December 2020. Unpaired t test was used to calculate statistical significance, *p < .05 and ****p < .0001
Figure 9. A model depicting the roles of vaccination and pathogen exposure on COVID-19 induced mortality: Countries having a vaccine providing broader protection, such as BCG, along with continuous exposure to pathogens provides effective cross immunity and thus lowers the numbers of COVID-19 induced deaths. It is possible that this combination will increase protection against newer pathogens in the future