Figures & data
Figure 1. Flow chart of included studies on rabies vaccine
Figure 2. Publication trends in rabies vaccine (1991-2020)
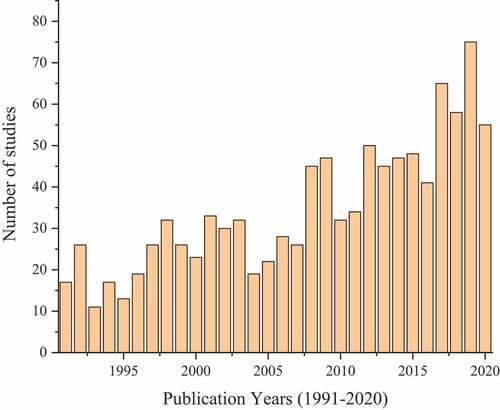
Table 1. Characteristic features of included studies on rabies vaccine
Table 2. Top-10 most attractive journals in rabies vaccine
Table 3. Top-10 most cited studies on rabies vaccine
Figure 3. Minimum cluster size was fixed at 3. Four clusters are formed; red represents cluster 1 (n = 10 items), green represents cluster 2 (n = 7 items), blue represents cluster 3 (n = 5 items), and yellow represents cluster 4 (n = 4 items). (a) Network visualization of co-authorship countries (weights: documents). (b) Overlay visualization of co–authorship countries by time 1991-2020 (weights: documents, scores: average publications per year)
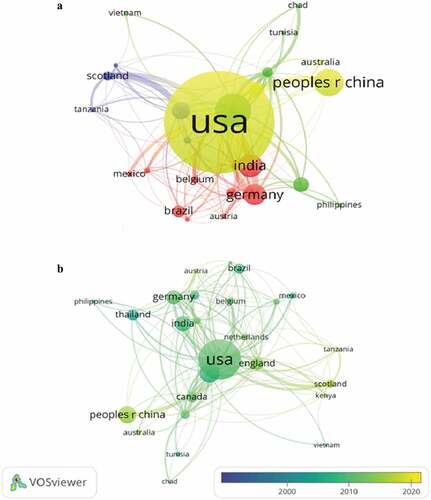
Figure 4. Minimum cluster size was fixed at 5, however six clusters are formed; red represents cluster 1 (n = 121 items), green represents cluster 2 (n = 109 items), blue represents cluster 3 (n = 95 items), yellow represents cluster 4 (n = 93 items), purple represent cluster 5 (n = 66 items), light–blue represents cluster 6 (n = 50 items), and orange represent cluster 7 (n = 5 items). (a) Network visualization of all keywords (wieghts: occurences). (b) Overlay visualization of all keywords by time 1991-2020 (wieghts: ocurrences, score: average publications per year)
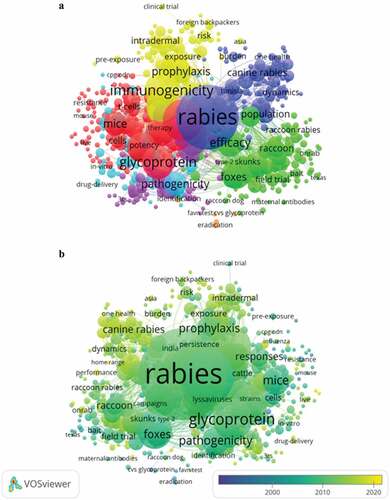
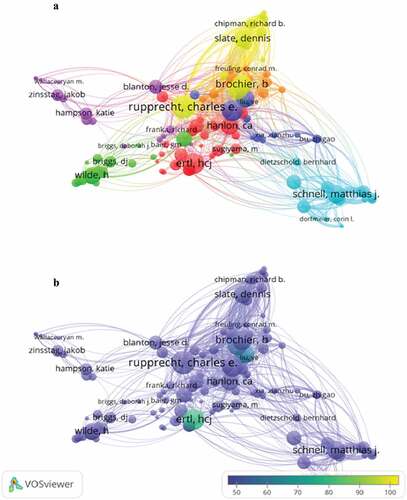
Figure 5. Minimum cluster size was 5. However, seven clusters are formed; red represents cluster 1 (n = 27 items), green represents cluster 2 (n = 22 items), blue represents cluster 3 (n = 17 items), yellow represents cluster 4 (n = 16) items, purple represent cluster 5 (n = 16 items), light-blue represents cluster 6 (n = 14 items), and orange represents cluster 7 (n = 11 items). (a) Network visualization of authors citation (wieghts: citations). (b) Overlay visualization by citations (wieghts: citations, scores: citations, minimum score = 50, maximum = 100)