Figures & data
Figure 1. Timepoints of sample collection. The three vaccine doses were administered at the ages of 8, 12, and 16 weeks old, respectively. Stool samples were collected seven times from a subset of the participants (before administration of the second vaccine dose and at 1, 2, and 4 weeks after the administrations of the second and third vaccine doses)
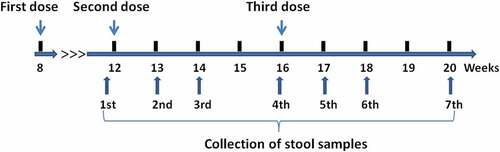
Figure 2. Trial enrollment and outcome profile. Stool samples were collected before administration of the second vaccine dose and at 1, 2, and 4 weeks after the administrations of the second and third vaccine doses, yielding a total of 797 samples (owing to some participants failing to provide samples at all timepoints, not all participants have data for each sampling timepoint). bOPV, bivalent (poliovirus types 1 and 3) oral polio vaccine; IPV, inactivated polio vaccine; tOPV, trivalent oral polio vaccine
Table 1. Poliovirus-specific intenstinal mucosal IgA immunized with IPV-bOPV-bOPV, IPV-IPV-tOPV, IPV-IPV-tOPV
Figure 3. The relative concentration of intestinal mucosal IgA specific to each type of poliovirus between shedders and non-shedders in each sequential vaccination schedule. The third vaccine dose was administered at 16 weeks of age. Participants were classified as shedders or non-shedders according to their viral shedding status after administration of the third vaccine dose. (a–c) The relative concentration of PV1-IgA between shedders (n = 11) and non-shedders (n = 28) in IPV-bOPV-bOPV (a), shedders (n = 21) and non-shedders (n = 18) in IPV-IPV-tOPV (b), and shedders (n = 18) and non-shedders (n = 20) in IPV-IPV-bOPV (c). (d–f) The relative concentration of PV3-IgA between shedders (n = 8) and non-shedders (n = 31) in IPV-bOPV-bOPV (d), shedders (n = 19) and non-shedders (n = 20) in IPV-IPV-tOPV (e), and shedders (n = 24) and non-shedders (n = 14) in IPV-IPV-bOPV (f). (g) The relative concentration of PV2-IgA between shedders (n = 24) and non-shedders (n = 15) in IPV-IPV-tOPV. A t-test was used for comparison of the means of intestinal mucosal IgA between the shedders and non-shedders at the same timepoints. *p < .05, **p < .01, ***p < .001
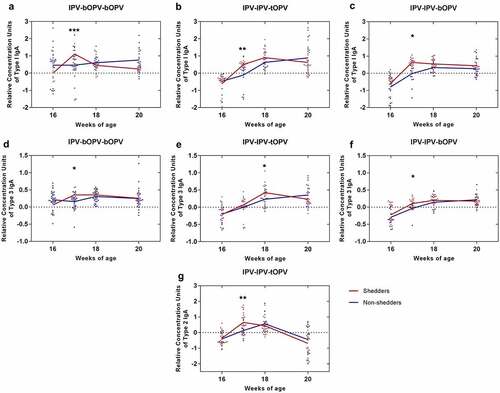
Figure 4. Relationship between intestinal mucosal immunity and serum neutralizing antibody . (a) PV1-IgA and PV1-specific serum neutralizing antibody at one week after administration of the last vaccine dose (17 weeks of age; n = 109). (b) PV2-IgA and PV2-specific serum neutralizing antibody at 17 weeks of age (n = 38); data from the IPV-IPV-tOPV group only. (c) PV3-IgA and PV3-specific serum neutralizing antibody at 17 weeks of age (n = 109). The x-coordinate of each point corresponds to the log2 reciprocal titer of serum neutralization; the y-coordinate of each point corresponds to the relative concentration units of IgA