Figures & data
Table 1. Clinical characteristics of enrolled participants
Figure 1. Isotype usage of different B cell subsets. Relative amounts of isotypes at each time point (a, b) and changes in isotype distribution between T1 and T4 (c). ***p < .001; **p < .01; *p < .05. T1, right before vaccination; T2, 7 days following the first dose; T3, 7 days following the second dose; T4, 7 days following the third dose. MB, memory B cells; NB, naïve B cells; PC, plasma cells; IgA, IgA type B-cell receptor; IgG, IgG type B-cell receptor; IgM, IgM type B-cell receptor
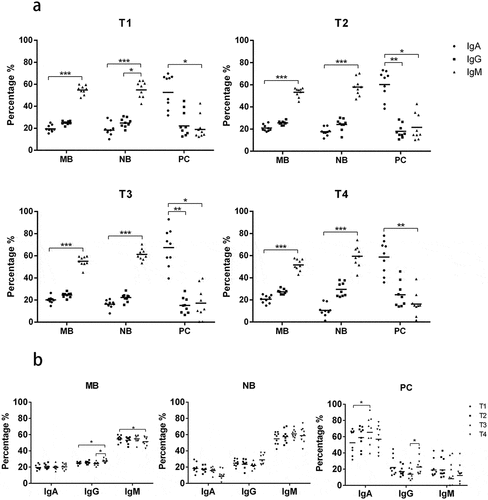
Figure 2. Diversity of BCR heavy chain repertoires during hepatitis B vaccination. (a) Dynamic changes in the diversity of MB cell repertoires in each participant. (b) Comparison of diversity between time points in different B cell subsets. (c) The correlation between CD4+ T and MB cell diversity changes. ***p < .001; *p < .05. NSDE, the normalized Shannon diversity index. P1, P2, P3, P4, P5, P6, P7, P8, and P9 represent participant 1, 2, 3, 4, 5, 6, 7, 8, and 9, respectively. T cell change represents diversity changes between each two time points in CD4+ T cells; B cell change represents diversity changes between each two time points in memory B cells (MB). T2-T1, T3-T2, T4-T2, T3-T1, T4-T1, and T4-T3 represent values of NSDE at latter time points minus that at earlier time points
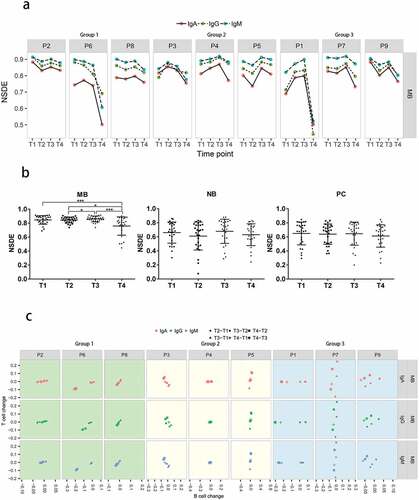
Table 2. Correlation between diversity changes of B cell subsets and CD4+ T cells
Figure 3. Shared clones between individuals in different subsets. The number of participants sharing the clones is shown by color differences. T cell represents shared clones in CD4+ T cells repertoires. B cell represents shared clones in memory B cell, naïve B cell, or plasma cell repertoires; IgA, IgG, IgM represent shared clones in IgA, IgG, or IgM type B-cell receptor repertoires, respectively. MB, NB, PC represent shared clones in memory B cell, naïve B cell, and plasma cell repertoires, respectively
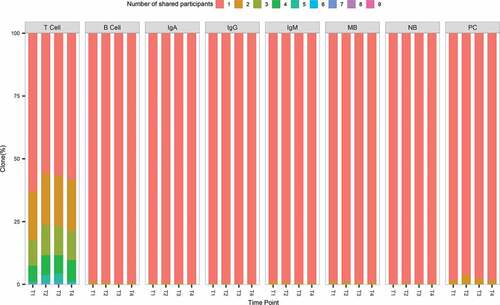
Figure 4. Shared clones between two time points. (a) The percentage of share clones between two time points in different subsets. A time-point pair was composed by a later time point and a time point before it, e.g., “T2inT1”. The percentage of shared clones was computed by the number of shared clones between these two time points (T2 & T1) divided by the number of clones at the later time point (T2). (b) Boxplot results of percentages sorted by cell-type form (a). (c) Boxplot results of percentages sorted by isotypes form (a) and comparison between groups. Group1 consists of participants 2 (P2), 6 (P6), and 8 (P8), who had anti-HBs concentrations greater than 10 mIU/ml after the first vaccine dose and greater than 1000 mIU/ml after the third vaccine dose. Group2 consists of participants 3 (P3), 4 (P4), and 5 (P5), whose serum antibody concentrations were lower than 10 mIU/ml after the first 2 vaccine doses and were higher or just below 1000 mIU/ml after the third vaccine dose. Group3 consists of participants 1 (P1), 7 (P7), and 9 (P9), whose serum antibody concentrations were lower than 10 mIU/ml after the first 2 vaccine doses and were lower than 300 mIU/ml after the third vaccine dose. ***p < .001; **p < .01; *p < .05
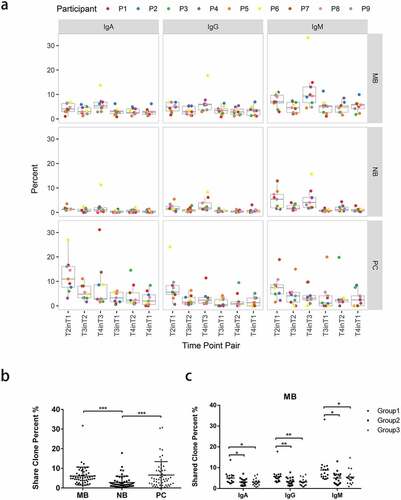
Figure 5. The percentages of clones sharing the same CDR3 amino acid sequence between each B cell subsets at the same time point (a, c) and at different time points (b, d). Percentages of shared clone at the same time point (a, c) or different time points (b, d) were summarized from Fig. S5 according to their time-point pair information, respectively. ***p < .001; **p < .01; *p < .05
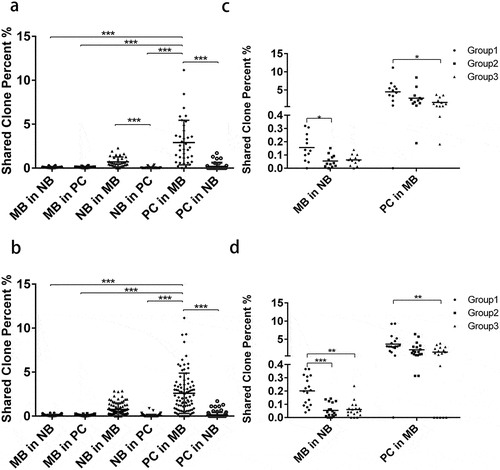
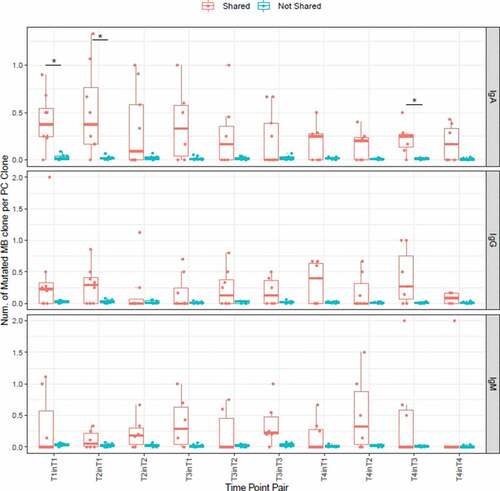
Figure 6. Numbers of mutated MB clone per one PC clone in shared and not-shared group. The shared group consists of PC clones shared in MB at the time point. On the x-axis, a time point pair is in the form of “Ta in Tb”, which indicates the sharing of PC clones at the time point of “Ta” and MB clones at the time point of “Tb”. * p < .05, Wilcoxon signed rank test