Figures & data
Table 1. Rubella seronegativity in each characteristic of mothers and babies
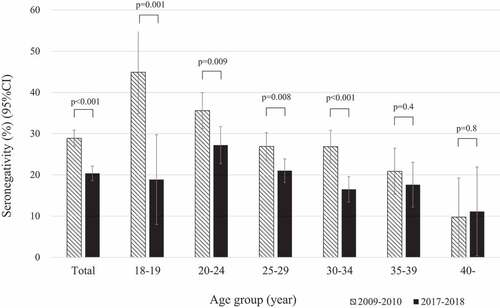
Figure 1. Rubella seronegativity in total and each mothers’ age group in Nha Trang, Vietnam, 2009–2010 and 2017–2018
P-values: Rubella seronegativity in the total cohort and each mother’s age group were compared with those in a previous study,Citation3 using the chi-squared test