Figures & data
Table 1. Demographic and individual predictors of likelihood of getting a coronavirus vaccine
Table 2. Perceptions among individuals who are hesitant about COVID-19 vaccines
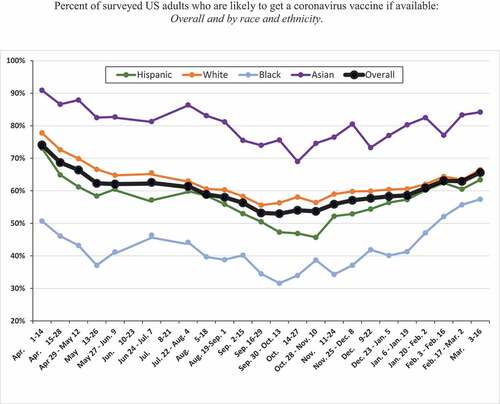
Figure 1. The figure shows likelihood of getting a coronavirus vaccine, or a self-report of having been vaccinated, for each two-week period from April 1, 2020, to March 16, 2021, except for June 10–23 and July 8–21, 2020 (surveys were not done during those two periods). The margin of error for 95% confidence level ranged from: Hispanic (5.1%-7.3%%), White (1.8%-2.9%), Black (5.2%-8.7%), Asian (4.8%-8.0%), Overall (1.7%-2.5%) per survey period
Percent of surveyed US adults who are likely to get a coronavirus vaccine if available: Overall and by race and ethnicity.