Figures & data
Figure 1. Plain language summary
Figure 2. Study design
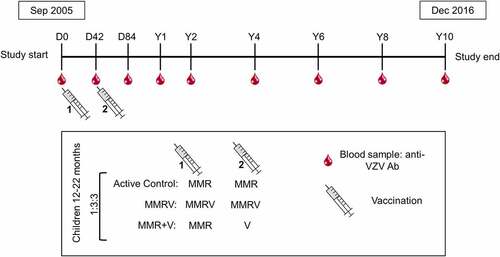
Figure 3. Occurrence of varicella cases in the Active Control group (per-protocol cohort for efficacy)
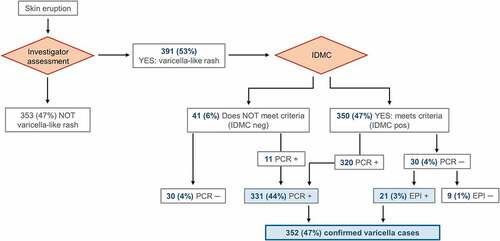
Figure 4. Flow of the participants included in the Active Control group
Supplementary Table S1: Demographic characteristics (total vaccinated cohort) and 10-year varicella person-year rate (per-protocol efficacy cohort) of study participants per country in the Active Control group
Table 1. Demographic characteristics of participants in the Active Control group (per-protocol cohort for efficacy; N = 744)
Table 2. Anti-VZV antibody levels in the Active Control group participants without a varicella case, or with a case detected since previous visit or before previous visit until each timepoint (per-protocol cohort for efficacy)
Figure 5. Evolution of anti-VZV antibody GMCs (lines) and the number of participants (table) in the Active Control group (per-protocol cohort for efficacy)
Figure 6. Reverse cumulative distribution curves of anti-VZV antibody concentrations in Active Control group participants without a varicella case (per-protocol cohort for efficacy)
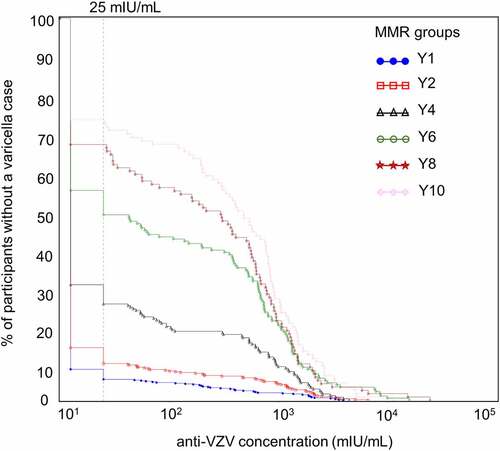
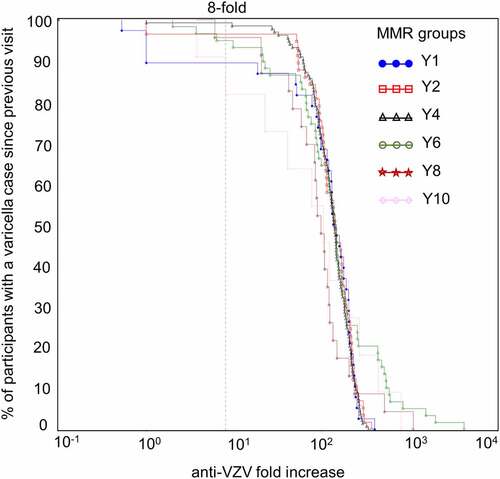
Figure 7. Reverse cumulative distribution curves of anti-VZV antibody concentration fold increases in Active Control group participants with a confirmed varicella case since the previous visit (per-protocol cohort for efficacy)