
Figures & data
Table 1. Inclusion and exclusion criteria
Table 2. Overview of main results from the included studies (N = 22)
Figure 1. PRISMA flowchart
n, sample size; PRISMA, Preferred Reporting Items for Systematic Reviews and Meta-analyses; yoa, years of age.
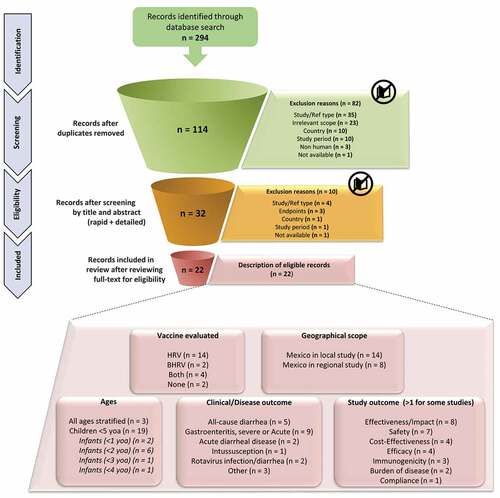
Figure 2. Distribution of studies by (a) Study design, (b) Age of study population, (c) Study outcome, and (d) Clinical endpoint
RTC, randomized control trial; yoa, years of age.
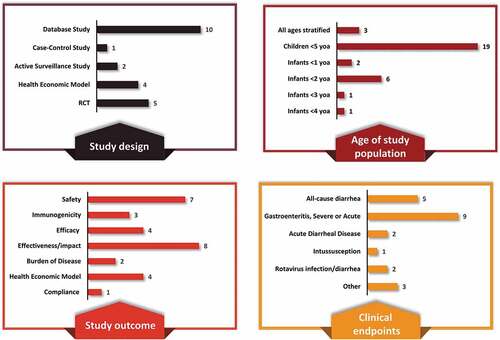
Figure 3. Summary characteristics of studies by vaccine and study outcome*
*Numbers do not add to N = 22 as a study can count toward more than one category (>1 endpoint per study).
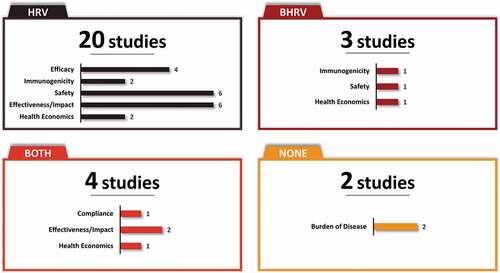
Figure 4. Risk of bias assessment of observational studies using STROBE checklist.Citation18,Citation19
STROBE, Strengthening the Reporting of Observational studies in Epidemiology.
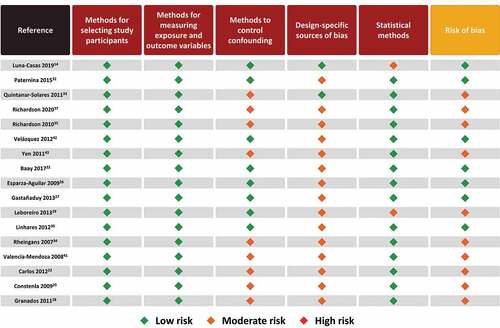
Figure 5. Risk of bias assessment of RCTs using Cochrane risk bias of tool.Citation20
RCT, randomized controlled trial.
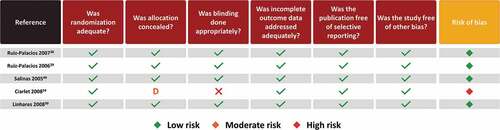
Figure 6. Plain Language Summary

Supplemental material