Figures & data
Figure 1. Generation of SARS-CoV-2 S SAB-185 polyclonal antibody. (a) Schedule of Tc bovine vaccinations V1 to V5, serum/plasma collection and plasma pooled for SAB-185 Lot 1, Lot 5 and Lot 6 purification as described in Materials and Methods. (b) Geometric mean SARS-CoV-2 spike ELISA antibody titers of SAB-185 Lot 1, 5 and 6 versus the negative control human IgG purified from Tc bovine pre-immune plasma. The negative control geometric mean titer (GMT) was calculated from six experiments. The Lot 1 GMT was from four experiments, Lot 5 GMT was from two experiments and Lot 6 was from a single experiment. (c) PRNT80 titers against the Munich SARS-CoV-2 P3 strain (Spike D614G) for a negative control pAb and SAB-185 Lot 1, Lot 5, and Lot 6. Concentrations of each pAb were normalized prior to serial 2-fold dilutions and 80% neutralization endpoints were calculated as described in Materials and Methods. The negative control endpoint was calculated from six replicate wells averaged at a 1:20 dilution of pAb. The Lot 1 endpoint was calculated from an average of two wells on a single plate (2 wells total) and Lot 5/Lot 6 were calculated from an average of two wells on three separate plates (6 wells total).
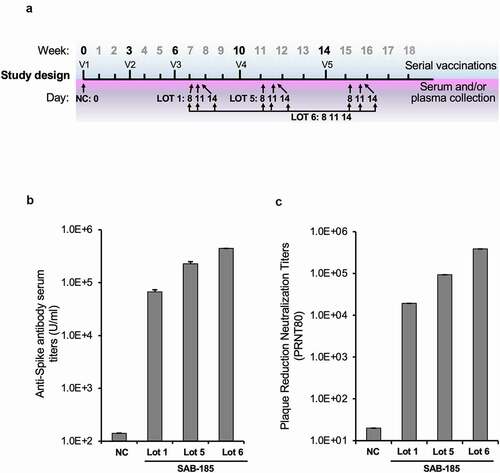
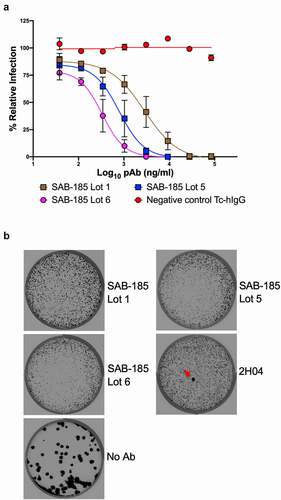
Figure 2. Neutralization of VSV-SARS-CoV-2 mutants by polyclonal antibody. (a) three SAB-185 pAbs were tested for neutralization of wild-type and (b) single amino acid substitution and (c) two amino acid substitution mutant VSV-SARS-CoV-2 (n = 4). Error bars represent the SEM. Data are representative of four independent experiments.
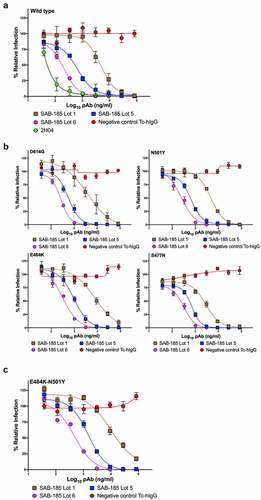
Table 1. Neutralizing SAB-185.
Figure 3. Selection of SAB-185 pAbs escape. (a) SAB-185 pAbs were tested for neutralizing activity against VSV-SARS-CoV-2 using an MOI of 1 to determine the concentration added into overlay. Error bars represent the SEM. Data are representative of four independent experiments. (b) Plaque assays were performed to isolate the VSV-SARS-CoV-2-S escape mutant on Vero E6 TMPRSS2 cells in the present of the indicated pAb in the overlay. The concentration of SAB-185 pAbs added in the overlay completely inhibited viral infection (See Figure 3a). Representative images of eight independent experiments are shown.