
Figures & data
Table 1. Participants’ attitude and practice scores about HPV infection and vaccination stratified by their characteristics (n = 2248)
Table 2. Participants’ attitude and practice on test items about HPV infection and vaccination (n = 2248)
Figure 1. Descriptive analysis of reasons for not being vaccinated (n= 1494).
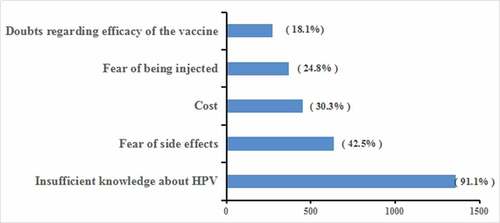
Table 3. Participants’ positive answers to attitude and practice of HPV infection and vaccination stratified by characteristics
Table 4. Multivariable logistic regression analysis for items of attitude and practice about HPV infection and vaccination
Table 5. Multiple linear regression analysis for factors influencing attitude and practice scores