Figures & data
Table 1. Characterization of the approved COVID-19 vaccines worldwide.Citation9,Citation14–22.
Table 2. Descriptive analysis of the COVID-19, demographics data from Brazilian territory, gross domestic product (GDP) and intensive care units (ICUs) availability.Citation25–30.
Table 3. COVID-19 vaccination plan in Brazil and the number of COVID-19 vaccines applied according to vaccine type and first or second dose.Citation13,Citation25,Citation29.
Table 4. COVID-19 vaccine [Coronavac (Sinovac™), AZD1222 (AstraZeneca/Oxford™), and BNT162b (Pfizer/BioNTech™)] doses status in Brazil by states and Federal District.Citation13,Citation29.
Table 5. Number of vaccines and percentage of the population that received each COVID-19 vaccine in Brazil.Citation13,Citation29.
Figure 1. Percentage of population vaccinated according the first and second doses by states and Federal District.
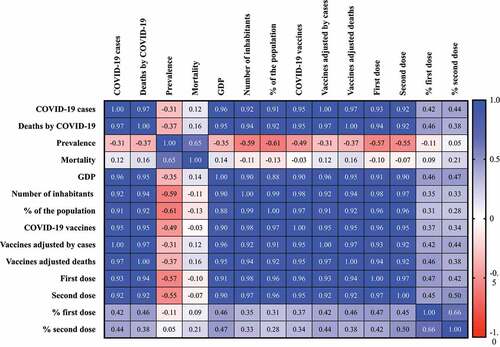
Figure 2. Spearman correlation matrix between the number of COVID-19 vaccines by Brazilian inhabitants, number of COVID-19 vaccines per 1 M of inhabitants, number of COVID-19 vaccines adjusted by COVID-19 cases and deaths by COVID-19, number and percentage of Brazilian population vaccinated with the first and second doses with number of individuals with COVID-19, number of deaths by COVID-19, incidence by 100,000 inhabitants, mortality by 100,000 inhabitants, gross domestic product (GDP), the number of Brazilian inhabitants by states and Federal District, % of the population and populational density and the number of intensive care units (ICUs) beds in Brazil. The calculation of number of vaccines per 1 M inhabitants was done based on the following formula: (number of vaccines by inhabitants) * 1 M. The number of vaccines adjusted by number of COVID-19 cases was calculated using the following formula: (number of COVID-19 cases by state or Federal District by all COVID-19 cases) * total number of vaccine doses. The number of vaccines adjusted by number of deaths by COVID-19 was calculated using the following formula: (number of deaths by state or Federal District by all deaths by COVID-19) * total number of vaccine doses. The percentage of vaccinated population was calculated using the following formula: (number of vaccine doses by number of individuals in each state and Federal District) * 100. In the figure it was not shown the results of correlations for population density, ICUs beds and vaccines per 1 M of inhabitants because the correlation coefficient was low. It was considered the following categorization: (very high positive/negative correlation) 0.9 to 1.0; (high positive/negative correlation) 0.7 to 0.9; (moderate positive/negative correlation) 0.5 to 0.7; (low positive/negative correlation) 0.30 to 0.50; (negligible correlation) 0.00 to 0.30.