Figures & data
Figure 1. Plain language summary to summarize the findings and highlight their clinical relevance.
Figure 2. Study design.
Figure 3. Participant flow chart.
Table 1. Demographic characteristics of the study participants (total vaccinated cohort)
Table 2. Vaccine efficacy estimates against confirmed varicella cases (according-to-protocol cohort for efficacy)
Figure 4. Anti-varicella zoster virus (VZV) antibody persistence during ten years of follow-up (adapted according-to-protocol cohort for persistence).
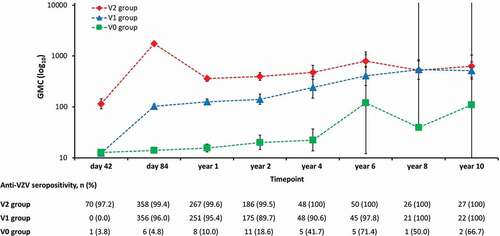
Figure 5. Anti-measles (A), -mumps (B), and -rubella (C) antibody persistence during two years of follow-up (adapted according-to-protocol cohort for persistence, subset for MMR testing).
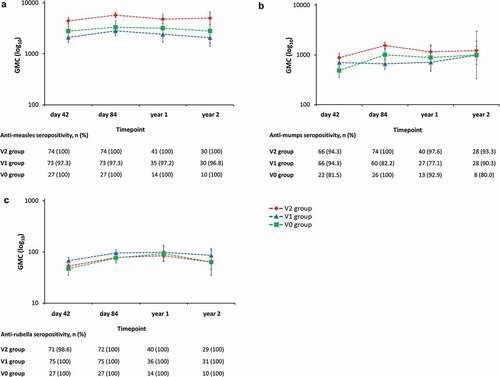
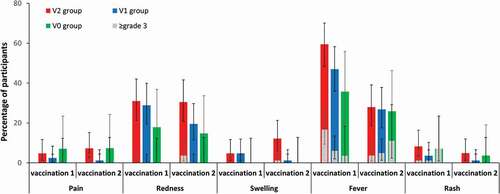
Figure 6. Incidence of solicited local adverse events (pain, redness, and swelling) from day 0 to day 3, and solicited general symptoms (fever and rash) from day 0 to day 42, after each dose (total vaccinated cohort, subset for MMR testing).