Figures & data
Table 1. Characteristics of survey respondents (n = 3123)
Figure 1. COVID-19 vaccination acceptability in China under the condition of the safety and efficiency of the vaccine is unknown (not provided). According to Lazarus et al.’s (2021) definition, ‘completely agree’ + ‘somewhat agree’ = responded positively; Neutral/No opinion = Neutral/No opinion; ‘somewhat disagree’ + ‘completely disagree’ = responded negatively.
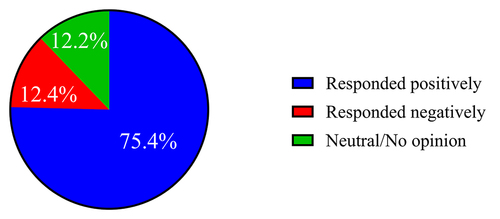
Figure 2. Mean ratings of the respondents’ ‘willingness to get vaccinated’ and ‘willingness to wait and see’ in conditions of know that COVID-19 vaccine has side effect/know that COVID-19 vaccine has no side effect/do not know whether COVID-19 vaccine has side effect or not (0 for very reluctant to and 100 for very willing to). Left bar represents ‘willingness to get vaccinated,’ whilst the right bar represents ‘willingness to wait and see.’
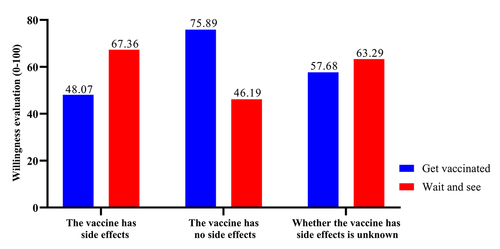
Figure 3. The frequency of evaluating results on a 6-point scale ranging from completely sure to make a decision now (1) to completely sure to make a decision after wait-and-see (6). Numbers above the bars represent the number of respondents in each scale who responded to the item ‘Please indicate when you think you can decide whether or not to get vaccinated.’
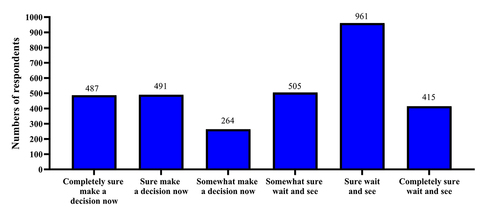
Figure 4. Percentage of respondents who chose ‘get vaccinated now,’ ‘not get vaccinated’ or ‘wait and see.’
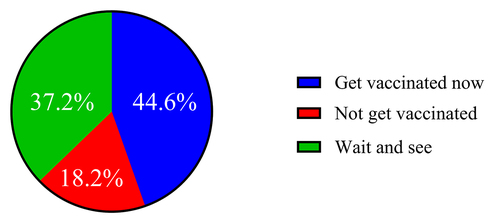
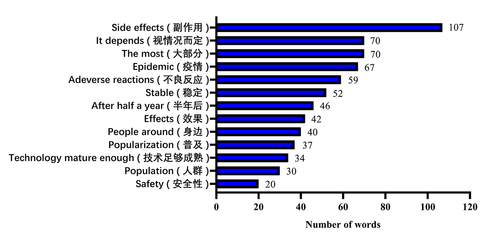
Figure 5. Analysis of the reasons why people chose not to be vaccinated and ‘wait and see.’