
Figures & data
Table 1. National vaccination schedule for infants in the Dominican Republic
Table 2. Mean vaccine coverage and performance of the immunization program at the national level, Dominican Republic 2019–2020
Figure 1. Trends in immunization coverage,dropout rate and cumulative COVID-19 cases by month,2019–2020.
Penta3 2020 = third dose of the pentavalent vaccine coverage in 2020.
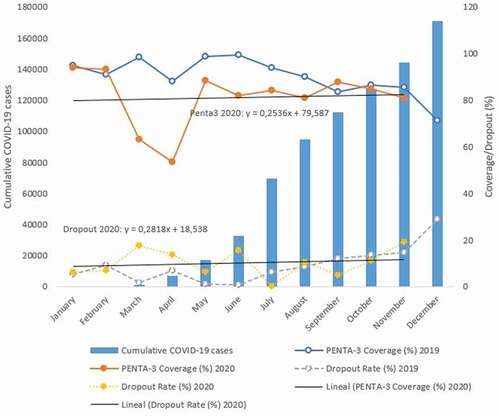
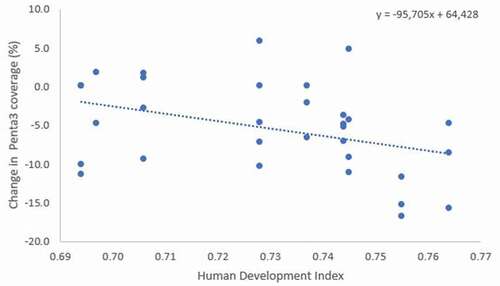
Figure 2. Correlation of change in Penta3 coverage with the Human Development Index, by province,2019–2020.
Dropout 2020 = dropout rate for 2020.
Supplemental material