
Figures & data
Figure 1. ZOE-LTFU clinical trial, recombinant zoster vaccine efficacy estimates (red and blue dots) and the corresponding estimates of vaccine efficacy and waning over time.
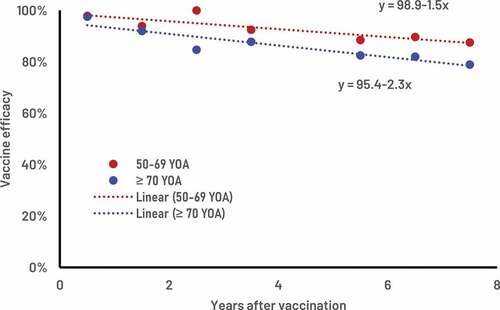
Table 1. Public health impact of both RZV and ZVL under base-case assumptions of 40% coverage (RZV second dose compliance of 70%) over a lifetime horizon from the age of vaccination
Figure 2. Number of cases avoided with RZV from the year of vaccination over the remaining lifetime by age cohort.
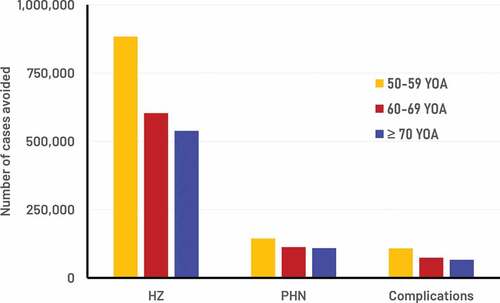
Figure 3. RZV vaccine efficacy estimates with associated annual wanings, public health impact in the German population and cost-effectiveness.
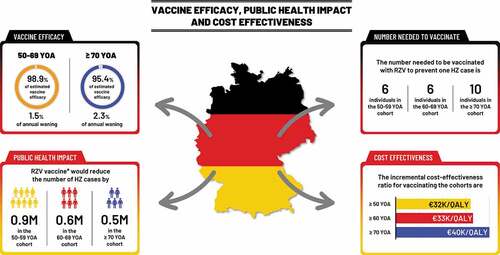
Table 2. Number needed to vaccinate to prevent one HZ case and one PHN case under base-case assumptions of 40% coverage (RZV second dose compliance of 70%) over a lifetime horizon from the age of vaccination
Table 3. Cost-effectiveness of RZV vs no vaccination for various vaccination starting ages: assuming a fixed cohort of 1 million with a vaccine coverage of 40%
Table 4. Cost-effectiveness of RZV vs no vaccination for various age cohorts