
Figures & data
Table 1. Patient characteristics
Figure 1. Kaplan-Meier estimates of PFS and OS of patients treated with a combined DC vaccination with a chemotherapy. (a and b) PFS and OS of all patients. (c and d) PFS and OS of patients who showed positive immune responses in either WT1 or MUC1 ELIspot assay (solid line) and patients who showed negative immune responses in both assays (dotted line).
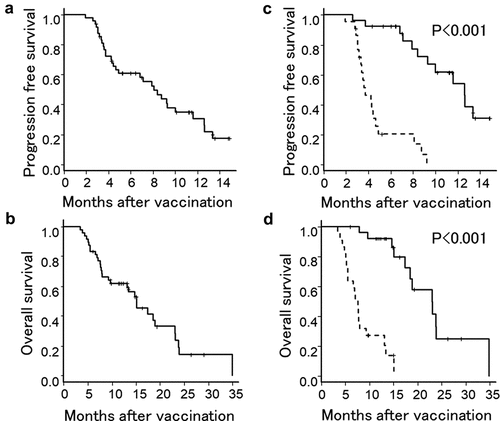
Table 2. Adverse events†
Figure 2. IFNɤ ELIspot assay.
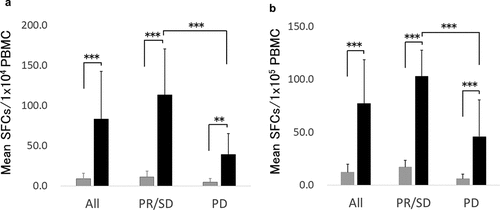
Table 3. Univariate analysis of the association of clinical factors with PFS and OS
Table 4. Univariate analysis of the association of laboratory factors with PFS and OS
Table 5. Univariate analysis of the association of immune-related factors with PFS and OS
Table 6. Multivariate analysis