Figures & data
Table 1. Vaccine attitudes by highest-probability assignment latent class. Top panel reports mean scores from a five-point Likert agree-disagree scale for each of the latent classes with each country weighted equally. Higher values reflect more pro-vaccine attitudes with reverse coded items indicated with an asterisk. Bottom panel reports the percentage in each class for each country (percentages should be read horizontally)
Table 2. Substantive latent class membership by demographics and political orientation
Figure 1. Support for vaccine mandates by substantive class (4-point Likert scale). The Strong Support and Support with Concerns classes support vaccine mandates dramatically more than the Vaccine Hesitant or Anti-Vax classes.
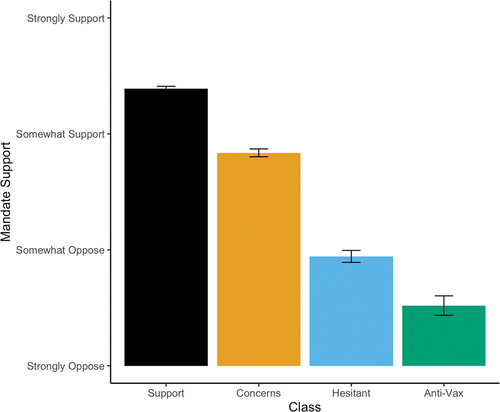
Figure 2. Belief in COVID-19 conspiracy theories (5-point Likert items) by substantive class. The Anti-Vax and Vaccine Hesitant subscribe to COVID-19 conspiracy theories more than other classes, especially the Strong Support class.
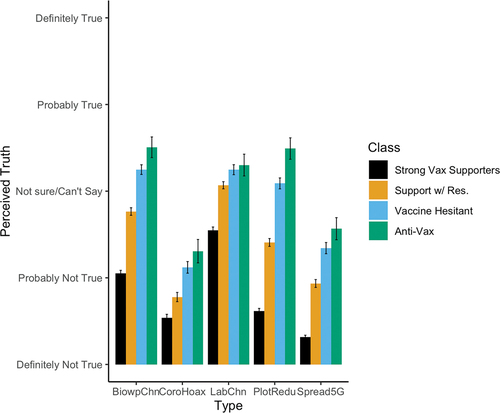
Figure 3. Percentage of each latent class in each COVID safety perception category. Low safety ratings include “not at all safe” or “not very safe.” High safety ratings include “somewhat safe” and “very safe.” Don’t know responses depicted separately. The Strong Support and Support with Concerns classes broadly view COVID-19 vaccines as safe, while the Anti-Vax see them as unsafe. The Vaccine Hesitant are more unsure about COVID-19 vaccine safety.
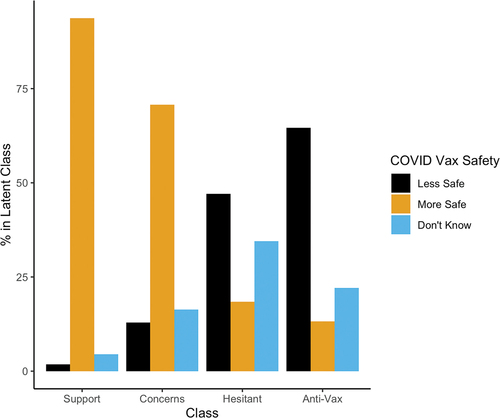
Figure 4. Percentage of each latent class in each COVID effectiveness perception category. Low effectiveness ratings include “not at all effective” or “not very effective.” High effectiveness ratings include “somewhat effective” and “very effective.” Don’t know responses depicted separately. The Strong Support and Support with Concerns classes broadly view COVID-19 vaccines as effective, while the Anti-Vax see them as ineffective. The Vaccine Hesitant are more unsure about COVID-19 vaccine effectiveness.
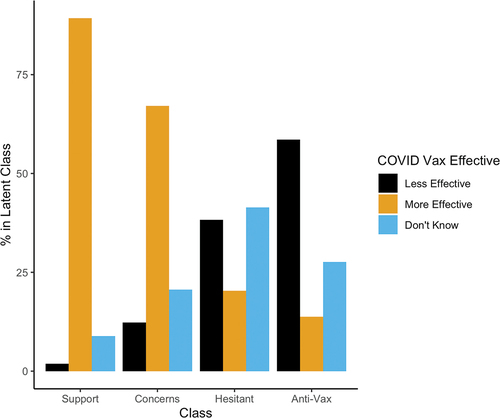
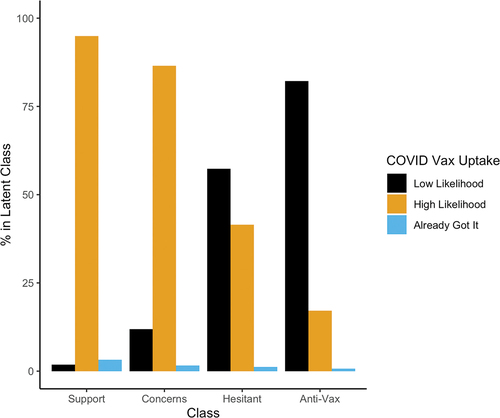
Figure 5. Percentage of each latent class in each COVID vaccine uptake intention category. Low likelihood ratings include “not at all likely” or “not very likely.” High likelihood ratings include “somewhat likely,” “very likely,” or “extremely likely.” The small group of respondents who already got the vaccine are in their own category. The Strong Support and Support with Concerns classes largely plan to get vaccinated, and the Anti-Vax do not. The Vaccine Hesitant are more evenly divided.