
Figures & data
Figure 1. Flowchart of the sampling process. In stage two, two cities in each province other than Hubei were selected: the capital city with a relatively higher socio-economic level and higher level of the pandemic, and a non-capital city with a relatively lower socio-economic level and lower level of the pandemic. Four cities in Hubei were selected, the capital city and three non-capital cities, based on the same stratification method of social-economic level and the pandemic scale, because the Hubei was the most severely impacted by the pandemic.
Table 1. Participant characteristics
Table 2. Comparison of COVID-19 vaccination intention and perception among respondents with different age and NCD status, (%, 95% CI)
Figure 2. Reasons for COVID-19 vaccine hesitancy in adults aged 18–59 and the elderly. Chi-square tests were used to examine differences in the proportion of each reason between participant groups by ages and NCD status. Between the adults aged 18–59 and the elderly, the proportions of reasons that have significant differences are “concern about vaccine safety” and “vaccine supply may be inadequate” are (p < .05). Between the adults aged 18–59 with and without NCD, the proportions of reasons that have significant differences are “concern about vaccine price,” “vaccine supply may be inadequate” and “vaccination may take too much time” (p < .05). The p-value of the chi-square test in the proportion of “the vaccine may not be effective” is 0.052. Between the elderly with and without NCD, no significant differences are found among the reasons. The p-value of the chi-square test in the proportion of “wait and see others getting vaccinated” is 0.051.
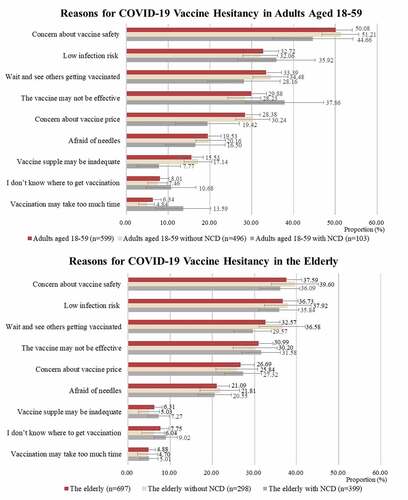
Table 3. Influence factors of willingness to accept COVID-19 vaccine by multiple logistic regressions
Table 4. Information sources for COVID-19 vaccines and vaccination among respondents with different age and NCD status, (%, 95% CI)
Table A1. Influence of demographic factors on COVID-19 vaccination intention among the total sample (n = 7259)
Table A2. Associations between COVID-19 vaccination intention and perception among respondents in groups of adult aged 18–59 and the elderly, (%, 95% CI)