
Figures & data
Table 1. Characteristics of selected respondents (N = 900)
Table 2. Responses to knowledge questions related to COVID-19 vaccine (N = 900)
Table 3. Perceptions about the COVID-19 vaccine among participants (N = 900)
Table 4. Attitudes toward COVID-9 vaccine (N = 900)
Figure 1. Percentage of respondents having adequate knowledge, positive perceptions, and attitude.
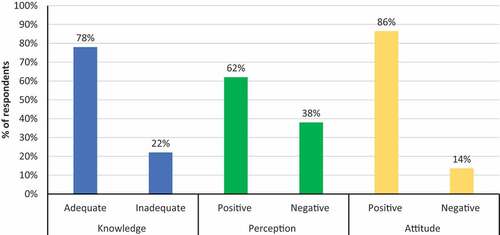
Figure 2. COVID-19 vaccine acceptability among the respondents (N = 900).
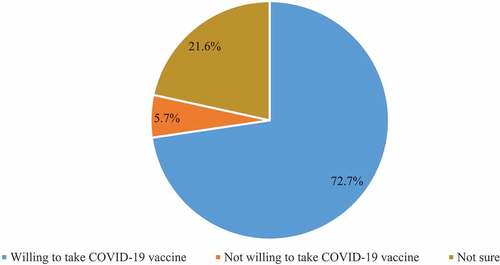
Figure 3. Reasons for refusing to receive COVID-19 vaccine in percentage. The reasons were asked only if the respondents were not interested in receiving the vaccine or not sure (N = 246).
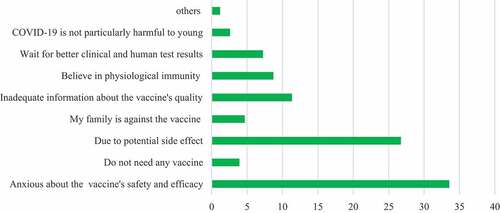
Table 5. Logistic regression showing factors significantly affect the respondent’s knowledge, perception, and attitude toward the COVID-19 vaccine (N = 900)
Table 6. Multinomial logistic regression showing the factors influencing the vaccine acceptability (N = 900)
Data availability statement
Data may be available from the corresponding author upon request.