
Figures & data
Table 1. Demographics, univariate and multivariate analyses of factors associated with students’ attitudes, knowledge, and willingness to vaccinate (N = 3256)
Table 2. Scores of attitudes, knowledge and willingness to vaccinate (N = 3256)
Figure 1. Color-coded bars from left to right represent seven different vaccination intentions: “Information sources”; “Vaccine choice”; “Vaccination form”; “Desired vaccine protection periods”; “Reasons for willingness to be vaccinated”; “Reasons for unwillingness/hesitation to be vaccinated”; and “Vaccine prices.” The different options are described below the same color bar chart. The number of students choosing one item/total number of students (3256) = the proportion of this item. The higher the proportion (i.e., more students choosing this item), the higher the willingness of students to choose this option.
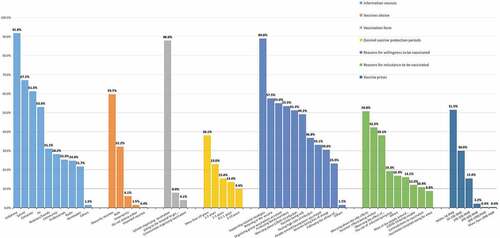
Table 3. The correlation betweenattitudes, knowledge, willingness and total scale