Figures & data
Table 1. Main information about the retrieved data on HIV-1 genetic diversity from WoSCC database
Figure 1. Annual distribution of publications on HIV-1 genetic diversity from 1998- May 15, 2021.
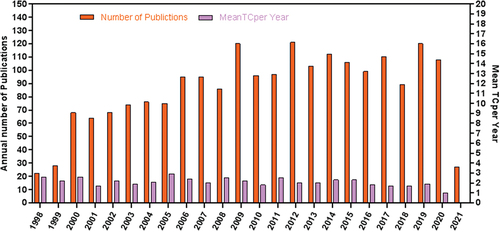
Table 2. Top 10 most prolific authors ranked by total number of publications
Figure 2. Top 10 most prolific authors’ in HIV-1 genetic diversity.
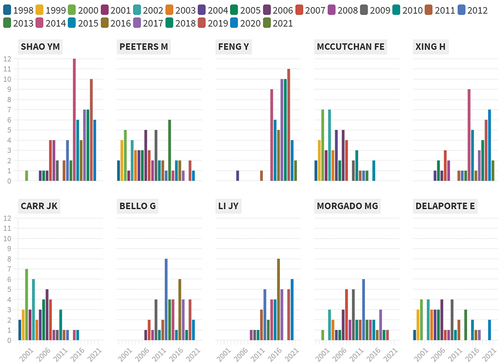
Table 3. Top 10 journals in HIV-1 genetic diversity research
Figure 3. Top 10 journals annual distribution of publications on HIV-1 genetic diversity.
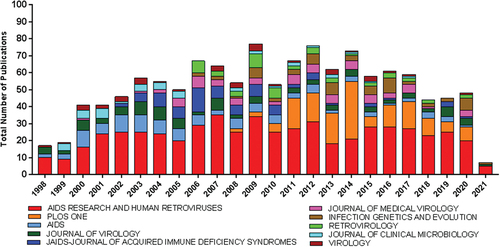
Table 4. Top 10 most productive institutions ranked by number of publications
Figure 4. (a) Corresponding authors’ countries annual distribution of publications. (b) Mutual collaboration between the corresponding authors’ countries in HIV-1 genetic diversity research.
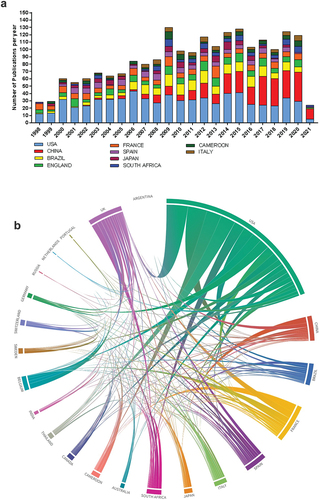
Table 5. Top 20 prolific corresponding authors countries and their collaborative publications
Table 6. Top 20 highly cited publications on HIV-1 genetic diversity
Figure 5. Coauthorship countries network visualization. Nine clusters between 50 coauthorship countries; Cluster 1 (Countries 14: Belgium, Bulgaria, Denmark, Finland, Greece, India, Israel, Italy, Luxembourg, Mexico, Netherlands, Romania, South Korea, Sweden; Cluster 2 (Countries 8: Burkina Faso, Cameroon, Cote Ivoire, Democratic Republic of Cango, France, Gabon, Republic of Cango, Senegal); Cluster 3 (Countries 6: England, Pakistan, Scotland, Uganda, USA, Zambia); Cluster 4 (Countries 6: Australia, Japan, Malaysia, China, Taiwan, Thailand); Cluster 5 (Countries 5: Angola, Argentina, Brazil, Peru, Portugal); Cluster 6 (Countries 4: Cuba, Russia, Spain, Switzerland); Cluster 7 (Countries 3: Canada, Iran, Kenya); Cluster 8 (Countries 3: Germany, South Africa, Tanzania); Cluster 9 (Countries 1: Nigeria).
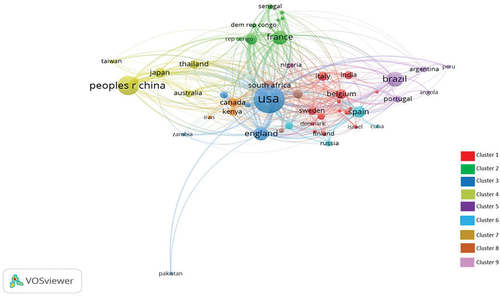
Figure 6. (a) Author keywords co-occurrence network visualization. Eight clusters were formed; Cluster 1: (13 keywords) Cluster 2: (10 keywords), Cluster 3: (9 keywords), Cluster 4: (9 keywords), Cluster 5: (7 keywords), Cluster 6: (6 keywords), Cluster 7: (4 keywords), cluster 8: (4 keywords). (b) Authors’ keywords wordcloud visualization analysis.
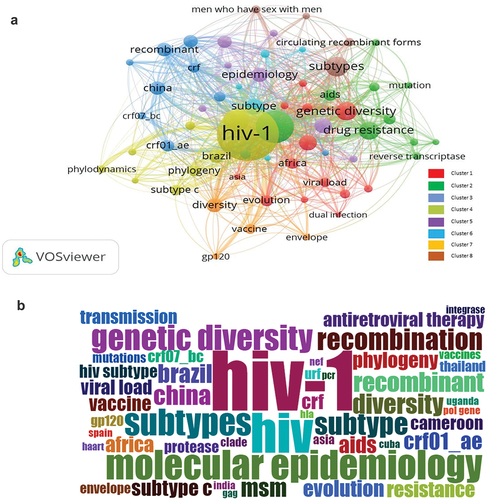
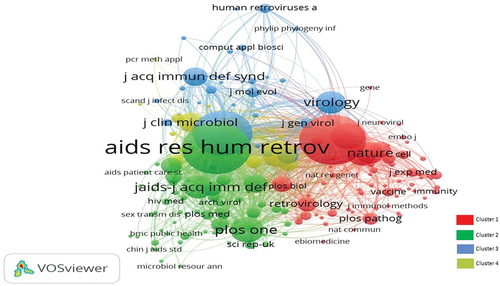
Figure 7. Cited sources network visualization. Four clusters were formed; Cluster 1 (sources 66), Cluster 2 (sources 64), Cluster 3 (Sources 29), Cluster 4 (sources 19).