4,038
Views
6
CrossRef citations to date
0
Altmetric
Immunotherapy – Research Paper

IL-6/IFN-γ double knockdown CAR-T cells reduce the release of multiple cytokines from PBMCs in vitro

, , & ORCID Icon
Pages 1-14 | Received 13 May 2021, Accepted 05 Dec 2021, Published online: 20 Jan 2022

Figures & data

Table 1. The primer sequences of shRNA

Figure 1. Establishment and screening of shIL-6 and shIFN-γ clones. (a-b). Establishment of IL-6 and IFN-γ knockdown (KD) clones. (c). Establishment of the IL-6/IFN-γ double KD clone. d. IL-6 and GFP cloned into the lentivirus vector pHR in sequence. IL-6 and GFP are fusion proteins. e. IFN-γ and GFP cloned into the lentivirus vector pHR in sequence. IFN-γ and GFP are fusion proteins. f. The IL-6 KD clones and IL-6/IFN-γ double KD clones effectively induced IL-6 mRNA expression in 293 FT cells, as determined by quantitative polymerase chain reaction (Q-PCR). g. The IFN-γ KD clones and IL-6/IFN-γ double KD clones effectively inhibited IFN-γ mRNA expression in 293 FT cells, as determined by Q-PCR. h. The IL-6 KD clones and IL-6/IFN-γ double KD clones effectively inhibited IL-6 protein expression in 293 FT cells, as determined by flow cytometry. i. The IL-6 KD clones and IL-6/IFN-γ double KD clones effectively inhibited the average fluorescence intensity of IL-6 at the protein level, as detected by flow cytometry. j. The IFN-γ KD clones and IL-6/IFN-γ double KD clones effectively inhibited IFN-γ protein expression in 293 FT cells, as determined by flow cytometry. k. The IFN-γ KD clones and IL-6/IFN-γ double KD clones effectively inhibited the average fluorescence intensity of IFN-γ at the protein level, as detected by flow cytometry. **P < .01, ***P < .001, mean ± SEM.
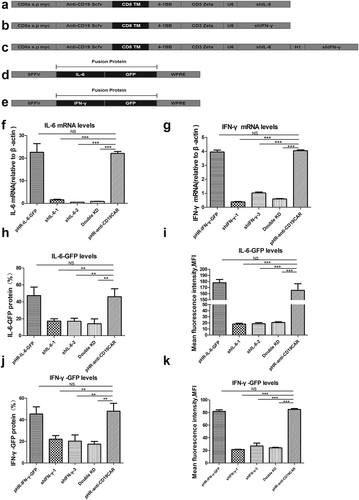
Figure 1. Establishment and screening of shIL-6 and shIFN-γ clones. (a-b). Establishment of IL-6 and IFN-γ knockdown (KD) clones. (c). Establishment of the IL-6/IFN-γ double KD clone. d. IL-6 and GFP cloned into the lentivirus vector pHR in sequence. IL-6 and GFP are fusion proteins. e. IFN-γ and GFP cloned into the lentivirus vector pHR in sequence. IFN-γ and GFP are fusion proteins. f. The IL-6 KD clones and IL-6/IFN-γ double KD clones effectively induced IL-6 mRNA expression in 293 FT cells, as determined by quantitative polymerase chain reaction (Q-PCR). g. The IFN-γ KD clones and IL-6/IFN-γ double KD clones effectively inhibited IFN-γ mRNA expression in 293 FT cells, as determined by Q-PCR. h. The IL-6 KD clones and IL-6/IFN-γ double KD clones effectively inhibited IL-6 protein expression in 293 FT cells, as determined by flow cytometry. i. The IL-6 KD clones and IL-6/IFN-γ double KD clones effectively inhibited the average fluorescence intensity of IL-6 at the protein level, as detected by flow cytometry. j. The IFN-γ KD clones and IL-6/IFN-γ double KD clones effectively inhibited IFN-γ protein expression in 293 FT cells, as determined by flow cytometry. k. The IFN-γ KD clones and IL-6/IFN-γ double KD clones effectively inhibited the average fluorescence intensity of IFN-γ at the protein level, as detected by flow cytometry. **P < .01, ***P < .001, mean ± SEM.

Table 2. The primer sequences of PT-PCR

Figure 2. The proliferation rate, cell phenotype, and infection efficiency of double knockdown (KD) anti-CD19 CAR-T cells did not change compared with those of original anti-CD19 CAR-T cells. a. The proliferation rate of anti-CD19 CAR-T cells, single KD anti-CD19 CAR-T cells, and double KD anti-CD19 CAR-T cells. NS P > .05, mean ± SEM. b. Phenotype of anti-CD19 CAR-T cells, single KD anti-CD19 CAR-T cells, and double KD anti-CD19 CAR-T cells, as detected by flow cytometry. c. CAR expression in anti-CD19 CAR-T cells, single KD anti-CD19 CAR-T cells, and double KD anti-CD19 CAR-T cells, as detected by flow cytometry.
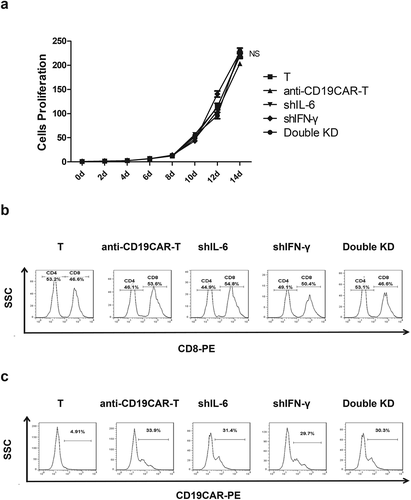
Figure 2. The proliferation rate, cell phenotype, and infection efficiency of double knockdown (KD) anti-CD19 CAR-T cells did not change compared with those of original anti-CD19 CAR-T cells. a. The proliferation rate of anti-CD19 CAR-T cells, single KD anti-CD19 CAR-T cells, and double KD anti-CD19 CAR-T cells. NS P > .05, mean ± SEM. b. Phenotype of anti-CD19 CAR-T cells, single KD anti-CD19 CAR-T cells, and double KD anti-CD19 CAR-T cells, as detected by flow cytometry. c. CAR expression in anti-CD19 CAR-T cells, single KD anti-CD19 CAR-T cells, and double KD anti-CD19 CAR-T cells, as detected by flow cytometry.

Figure 3. The specific cytotoxicity of double knockdown (KD) anti-CD19 CAR-T cells did not change compared with that of original anti-CD19 CAR-T cells. a. Expression of CD19 protein in K562 and K562-CD19 cells detected by flow cytometry. WT: wild type. The specific cytotoxicity of anti-CD19 CAR-T cells, single KD anti-CD19 CAR-T cells, and double KD anti-CD19 CAR-T cells, as detected by flow cytometry. NS P > .05, mean ± SEM. b. Specific cytotoxicity of anti-CD19 CAR-T cells, single KD anti-CD19 CAR-T cells, and double KD anti-CD19 CAR-T cells, as detected by flow cytometry. NS P > .05, mean ± SEM.
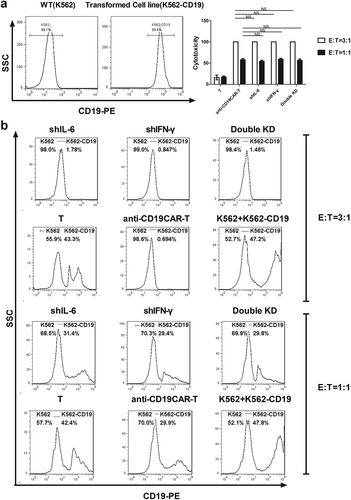
Figure 3. The specific cytotoxicity of double knockdown (KD) anti-CD19 CAR-T cells did not change compared with that of original anti-CD19 CAR-T cells. a. Expression of CD19 protein in K562 and K562-CD19 cells detected by flow cytometry. WT: wild type. The specific cytotoxicity of anti-CD19 CAR-T cells, single KD anti-CD19 CAR-T cells, and double KD anti-CD19 CAR-T cells, as detected by flow cytometry. NS P > .05, mean ± SEM. b. Specific cytotoxicity of anti-CD19 CAR-T cells, single KD anti-CD19 CAR-T cells, and double KD anti-CD19 CAR-T cells, as detected by flow cytometry. NS P > .05, mean ± SEM.

Figure 4. The mRNA expression of IL-6 (a), IFN-γ (b), IL-17 (c), IL-2 (d), TNF-α (e), IL-10 (f), and GM-CSF (g) in double knockdown (KD) anti-CD19 CAR-T cells decreased significantly, as detected by Q-PCR. **P < .01,***P < .001, mean ± SEM.
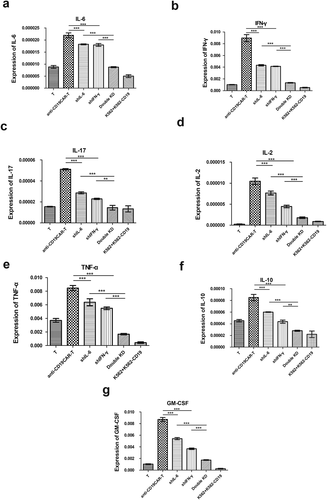
Figure 4. The mRNA expression of IL-6 (a), IFN-γ (b), IL-17 (c), IL-2 (d), TNF-α (e), IL-10 (f), and GM-CSF (g) in double knockdown (KD) anti-CD19 CAR-T cells decreased significantly, as detected by Q-PCR. **P < .01,***P < .001, mean ± SEM.

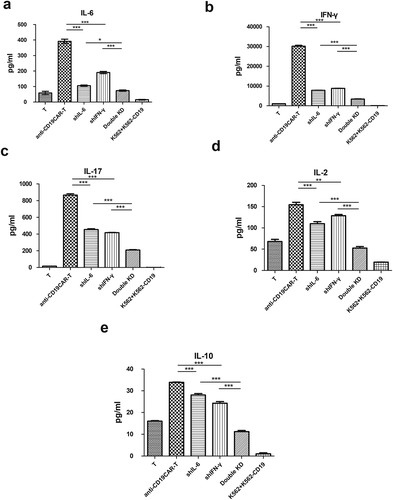
Figure 5. The amount of IL-6 (a), IFN-γ (b), IL-17 (c), IL-2 (d), and IL-10 (e) released by double knockdown (KD) anti-CD19 CAR-T cells decreased significantly at the protein level, as detected by ELISA. *P < .05, **P < .01,***P < .001, mean ± SEM.

Figure 5. The amount of IL-6 (a), IFN-γ (b), IL-17 (c), IL-2 (d), and IL-10 (e) released by double knockdown (KD) anti-CD19 CAR-T cells decreased significantly at the protein level, as detected by ELISA. *P < .05, **P < .01,***P < .001, mean ± SEM.

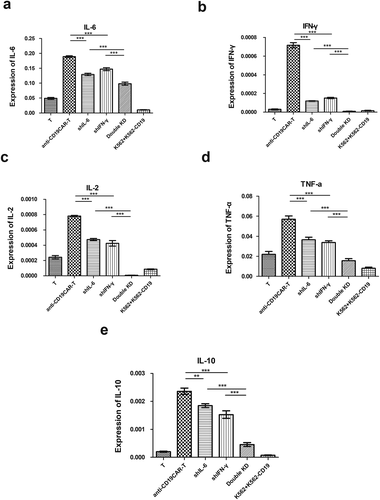
Figure 6. The expression of IL-6 (a), IFN-γ (b), IL-2 (c), TNF-α (d), and IL-10 (e) in PBMCs stimulated by the double knockdown (KD) anti-CD19 CAR-T cell killing conditioned medium was significantly reduced, as detected by RT-PCR. **P < .01, ***P < .001, mean ± SEM.

Figure 6. The expression of IL-6 (a), IFN-γ (b), IL-2 (c), TNF-α (d), and IL-10 (e) in PBMCs stimulated by the double knockdown (KD) anti-CD19 CAR-T cell killing conditioned medium was significantly reduced, as detected by RT-PCR. **P < .01, ***P < .001, mean ± SEM.