
Figures & data
Table 1. Organ-specific biomarker of irAEs
Figure 1. Comparison of the incidence of irAEs between PD-1/L1 inhibitors and CTLA-4 inhibitors in three categories.
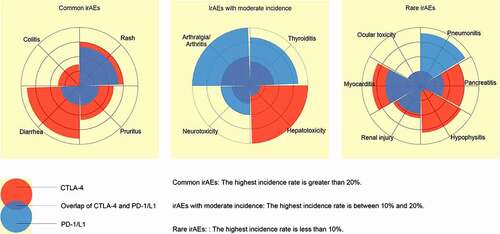
Figure 2. The incidence of each organ and organ-specific biomarkers of irAEs.
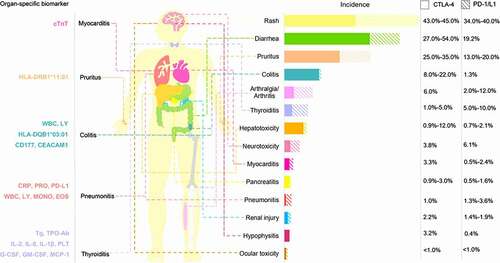
Table 2. Nonorgan-specific biomarkers of irAEs
Table 3. Population characteristic risk factors for irAEs