
Figures & data
Figure 1. Child-related factors influencing HPV knowledge and HPV vaccine acceptability. (a) Child gender. (b) Child age. (c) Child vaccination status. Boxplot representations of scores for, from left to right, HPV knowledge (score range: 0 to 40), knowledge and acceptance of vaccines in general (score range: −10 to 10), HPV vaccine knowledge (score range: 0 to 21) and HPV vaccine acceptability (score range: 0 to 5). The line inside the box represents the median. The lower and upper boundaries of each box indicate Q1 and Q3, respectively.
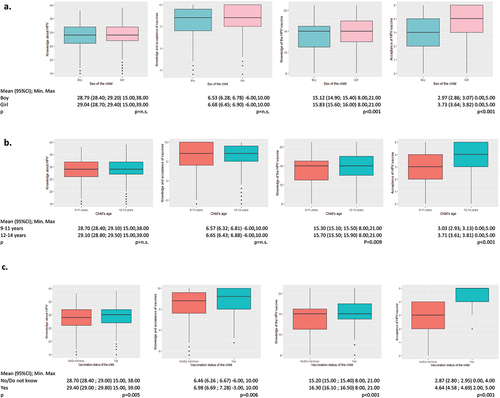
Figure 2. Factors related to family/parental characteristics influencing HPV knowledge and HPV vaccine acceptability. (a) Parent gender. (b) Parental HPV vaccination status. (c) Having at least one daughter. (d) Number of daughters in the family. (e) Having at least one daughter of vaccination age (≥9 y.o.). Boxplot representations of scores for, from left to right, HPV knowledge (score range: 0 to 40), knowledge and acceptance of vaccines in general (score range: −10 to 10), HPV vaccine knowledge (score range: 0 to 21) and HPV vaccine acceptability (score range: 0 to 5). The line inside the box represents the median. The lower and upper boundaries of each box indicate Q1 and Q3, respectively.
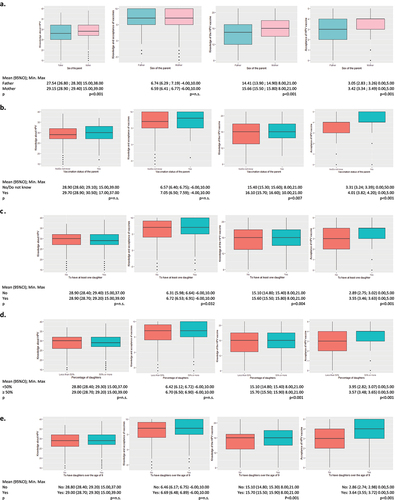
Table 1. Multivariate models for HPV knowledge and acceptability of HPV vaccine
Figure 3. Influence of consulting healthcare sources about HPV infection (a) or HPV vaccine (b) on HPV knowledge and HPV vaccine acceptability. Boxplot representations of scores for, from left to right, HPV knowledge (score range: 0 to 40), knowledge and acceptance of vaccines in general (score range: −10 to 10), HPV vaccine knowledge (score range: 0 to 21) and HPV vaccine acceptability (score range: 0 to 5). The line inside the box represents the median. The lower and upper boundaries of each box indicate Q1 and Q3, respectively.
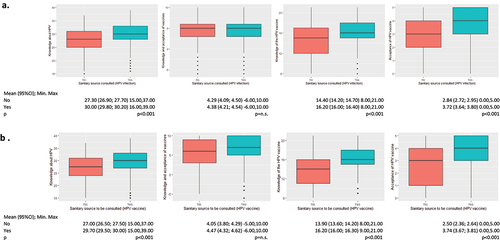
Table 2. Knowledge and acceptability scores according to whether or not respondents had consulted each healthcare source
Table 3. Knowledge and acceptability scores according to whether or not respondents had consulted other non-healthcare sources