Figures & data
Table 1. Area of residence for representative groups of healthcare professionals and adults ≥65 years
Figure 1. Attitudes of surveyed healthcare professionals toward vaccination in general. Scale: 0 – I do not agree at all … 10 – I totally agree.
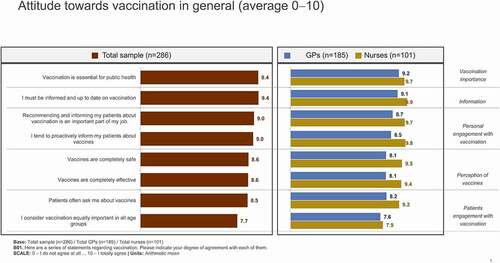
Figure 2. Attitudes of surveyed healthcare professionals toward influenza/pneumococcal vaccination in the ≥65 years target population. Scale: 0 – I do not agree at all … 10 – I totally agree.
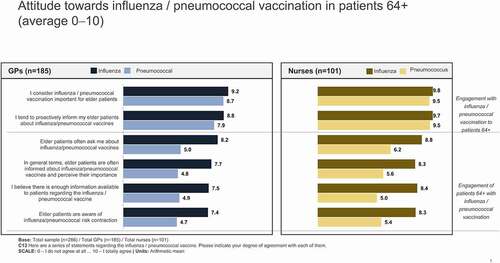
Figure 3. Preferred information sources of surveyed healthcare professionals for additional training about vaccination in the ≥65 years target population. Percent (%) of sample who selected response; multiple answers were possible. Scale: 0 – It is not necessary at all … 10 – It is totally necessary.
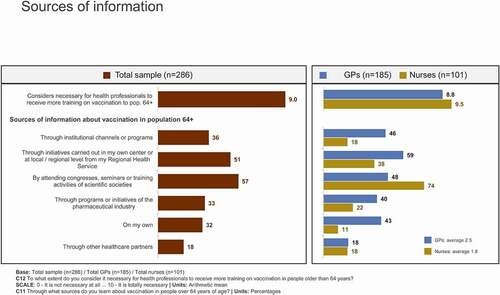
Figure 4. Impact of the COVID-19 pandemic on engagement of surveyed health professionals with vaccination in the ≥65 years target population. Scale: 0 – I do not agree at all … 10 – I totally agree.
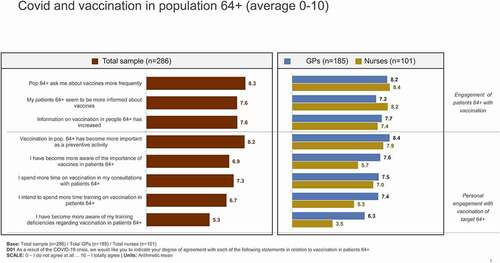
Figure 5. Attitudes of the ≥65 years sample group toward vaccines/vaccinations. Scale: 0 – Not at all agree … 10 – Strongly agree.
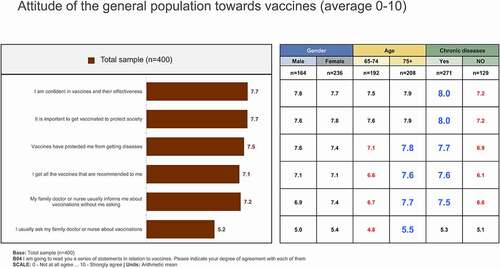
Figure 6. Reasons for getting vaccinated in the ≥65 years sample group. Percent (%) of sample who selected response; multiple answers were possible.
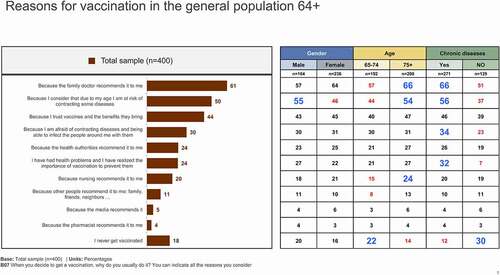
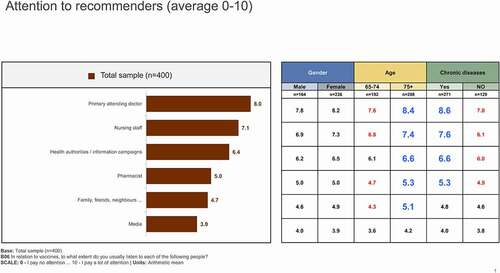
Figure 7. Most relevant recommenders of vaccination in the ≥65 years sample group. Scale: 0 – I pay no attention … 10 – I pay a lot of attention.