Figures & data
Table 1. Top 20 selected relevant hashtags based on their frequency
Table 2. Examples for anti- and pro-hashtags before COVID-19
Table 3. Examples for anti- and pro-hashtags after COVID-19
Figure 1. Social network visualization of twitter users on vaccination before COVID-19.
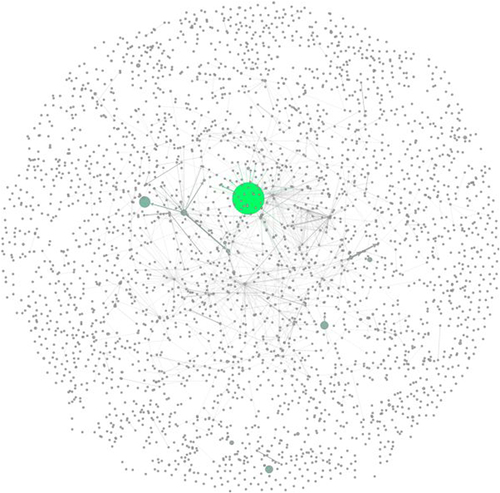
Figure 2. Social network visualization of twitter users on vaccination after COVID-19.
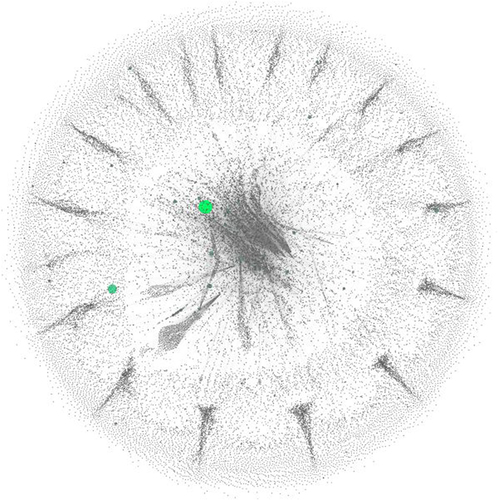
Table 4. Top 10 most influential users in pre-COVID-19 Twitter network according to in-degree and betweenness centrality measures
Figure 3. Visualization of pre-COVID-19 network according to In-degree. Size and color of the nodes are bigger and greener the more in-degree increases.
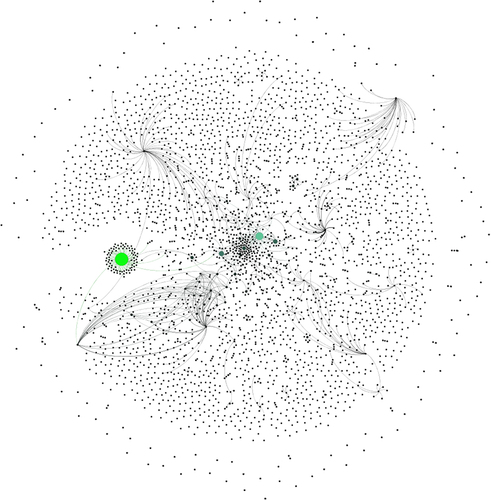
Figure 4. Visualization of pre-COVID-19 network according to betweenness centrality. Size and color of the nodes are bigger and greener the more betweenness centrality increases.
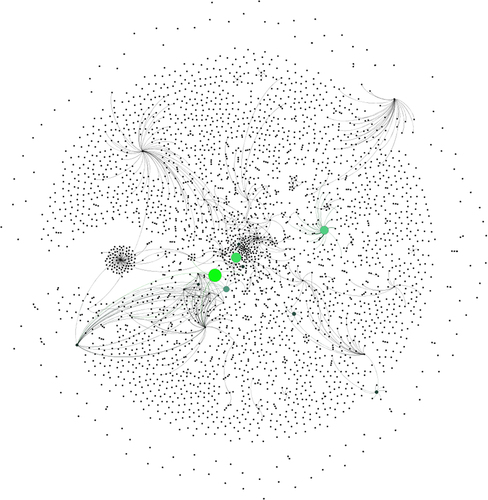
Table 5. The top 10 most influential users in post-COVID-19 Twitter network according to in-degree and betweenness centrality measures
Figure 5. Visualization of post-COVID-19 network according to the In-degree. Size and color of the nodes are bigger and greener the more in-degree increases.
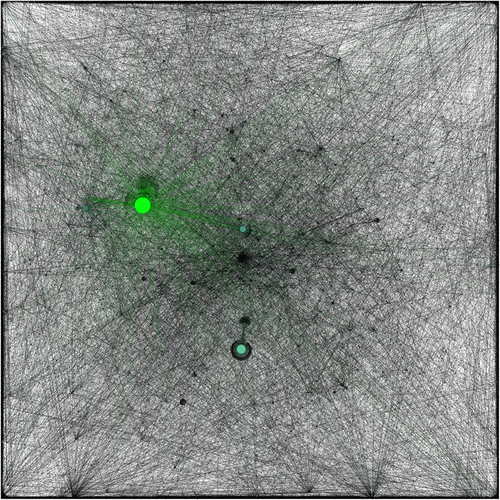
Figure 6. Visualization of post-COVID-19 network according to betweenness centrality. Size and color of the nodes are bigger and greener the more betweenness centrality increases.
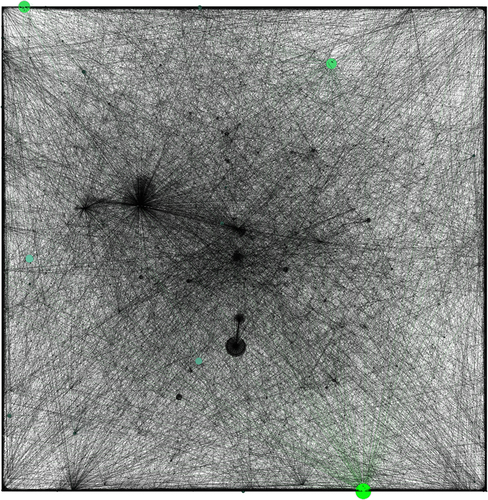
Table 6. Users and network statistics before and after COVID-19 in Turkey
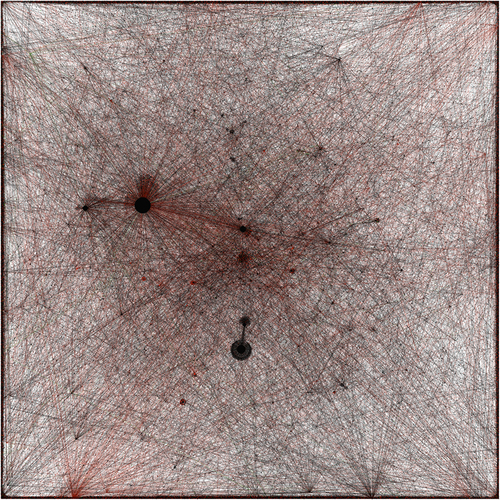
Figure 7. Visualization of anti/pro vaccination supporters before COVID-19 by in-degree. Red is anti, green is pro vaccination and black are neutral and blue is mixed.
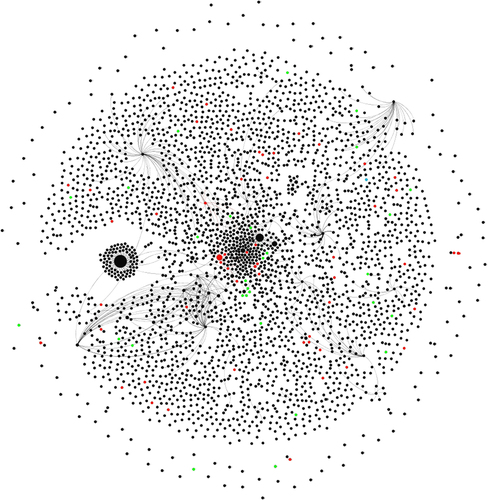
Figure 8. Visualization of anti/pro vaccination supporters after COVID-19 by in-degree. Red is anti, green is pro vaccination and black are neutral and blue is mixed.