
Figures & data
Table 1. Clinical characteristics of the participants. IUD = Intrauterine device
Figure 1. The overall prevalence of HPV genotypes in female university students. a) The infection prevalence is expressed as the number of individual positives for each genotype. From 129 samples, 74.41% (96 students) were positive for HPV (gray bar). b) Comparison of the most common HPV genotypes detected in all samples. The prevalence of most common high-risk HPV was HPV-18 13.95%; HPV-31 10.85%; HPV-16 9.3%, HPV-51 9.3%; and HPV-59 5.4%. c) Age distribution of sexual debut among students. The median age of coitarche for HPV- was 17.5 and for HPV+ girls was 17 years, which were used as a cutoff value for stratification of the girls by age. Fisher’s exact test showed that girls over 17 years old have a higher risk of HPV infection (P = .016). d) Comparison of the distribution of sexual partners among HPV- and HPV+ girls showed a statistically significant association between HPV infection and an increased number of lifetime sexual partners (Fisher’s exact test, P = .038). The cutoff value was the median number of lifetime sexual partners that was 3 for HPV- girls and 3.5 for HPV+ girls.
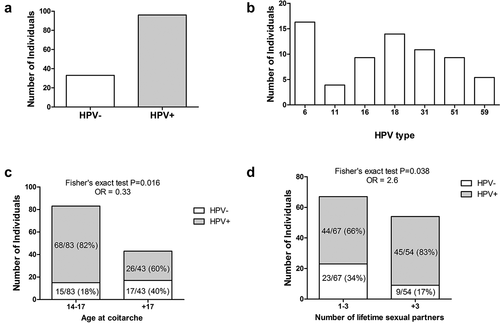
Figure 2. HPV-vaccination decrease the prevalence of some HPV types. a) The effect of HPV vaccination was evaluated in girls who received one, two or three doses of the vaccine in comparison with non-vaccinated girls. The percentages of infections were for HPV6 16% (12/75 girls), 12% (2/17), 12% (2/17) and 0% for unvaccinated, one dose, two doses and three doses of the vaccine, respectively. For HPV16 were 9% (7/75),18% (3/17), 6% (1/17), and 0%; for HPV18 were 12% (9/75), 18% (3/17), 12% (2/17), and 50% (2/4); for HPV31 were 15% (11/75), 12% (2/17), 6% (1/17), and 0%; and for HPV51 were 8% (6/75), 0%, 12% (2/17), and 25% (1/4). Data were analyzed by Fisher’s exact test. P-values less than 0.05 were considered statistically significant (*P < .05; **P < .01; ***P < .001). b) Percentage of seropositive individuals for HPV-16-specific IgG antibodies (left graph), and IgG anti-HPV-18 antibodies (right graph) in girls based on their vaccination status. Forty-three percent (32 of 75) of unvaccinated girls were seropositive for HPV16 and 41% (31/75) for HPV18. Forty-four percent (7/16) of vaccinated girls were seropositive for HPV16 after one dose of the HPV vaccine, 56% (9/16) for two doses, and 75% (3/4) for three doses. For HPV18 38% (6/16) of vaccinated girls were seropositive for one dose of the vaccine, while 56% (9/16) and 75% (3/4) were seropositive after two and three doses, respectively. c) Prevalence (percentage) of specific HPV infection in girls that were seropositive for HPV16 (left graph) or HPV18 antibodies (right graph). White bars represent unvaccinated girls and gray bar vaccinated girls. Data were analyzed by Fisher’s exact test. P-values less than 0.05 were considered statistically significant (*P < .05; **P < .01; ***P < .001).
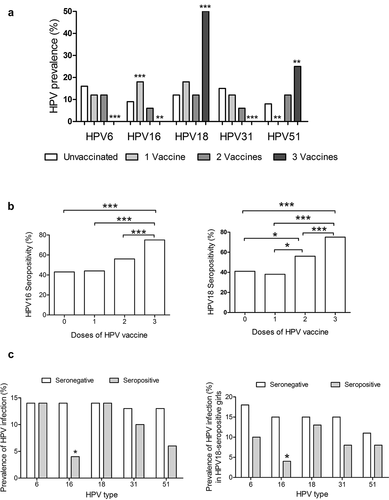
Figure 3. Heatmap analysis of seroprevalence, infection, and vaccination. Analysis of the levels of specific antibodies against HPV16 and 18, and their association with the presence of HPV infection and vaccination status were analyzed by heatmap. For the antibody levels the scoring star with blue color for negative or low levels and change to red color for higher amounts of antibodies detected by ELISA. For the vaccination status, the blue color represents unvaccinated girls and the increasing intensity in red represents 1, 2, or 3 doses of the HPV vaccine. Finally, for HPV infection blue color represent HPV- girls and light red color represent girls with HPV infection (any HPV). Each horizontal line represents one girl, and the sample number is indicated in the left side of the graph. Rectangles 1 and 2 show unvaccinated double seropositive girls, while rectangles 3 and 4 show vaccinated double seropositive girls.
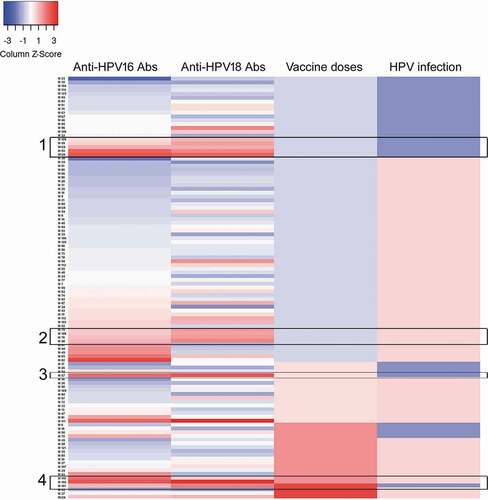
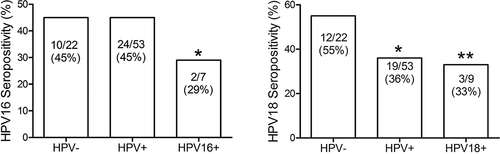
Figure 4. HPV seropositivity according to cervical HPV infection status. Percentages of HPV16 or HPV18 seropositive girls, which were grouped in those negative for HPV (HPV-), positive for any HPV (HPV+), and positive only for HPV-16 (HPV-16+) or HPV-18 (HPV-18+). Data were analyzed by Fisher’s exact test. P-values less than 0.05 were considered statistically significant (*P < .05; **P < .01).
Supplemental Material
Download MS Word (23.7 KB)Data availability statement
The data sets generated and/or analyzed during the current study are available from the corresponding author on reasonable request.