
Figures & data
Table 1. Demographics and characteristics of the vaccinated cohorts
Figure 1. Forest plot showing the percentages of solicited local and systemic adverse events (AEs) and the absolute differences in the proportion of participants with any grade solicited AEs across 7 days after second dose vaccination with 95% confidence intervals. CV and AZ in the first column refer to the prime vaccination. AE denotes an adverse event.
Figure 2. Binding antibody specific for SARS-CoV-2. (a) Total immunoglobulin specific to the receptor-binding domain (RBD) (Ig) and (b) Anti-RBD IgG in CV-AZ and AZ-CV groups on the day of the first dose (pre-dose 1), 4 and 10 weeks later for CV-AZ and AZ-CV groups, respectively (pre-dose 2), and 4 weeks after two dose completion (post-dose 2). Data points are the reciprocals of the individual. Lines indicate geometric means and bars indicate 95% confidence intervals. As a reference, RBD-specific total Ig and anti-RBD IgG were compared 4 weeks after two-dose completion (post-dose 2) among homologous CV and AZ vaccines. ** indicates p< .001.
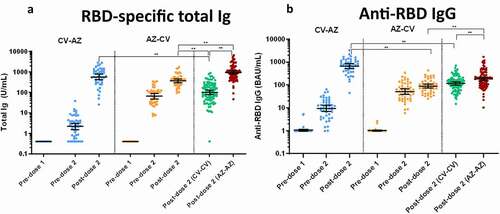
Figure 3. Anti-N IgG and Anti-S1 IgA. (a) SARS-CoV2-specific nucleocapsid (N) IgG (Anti-N IgG) and (b) Spike protein 1-specific IgA (anti-S1 IgA) in CV-AZ and AZ-CV groups on the day of the first dose (pre-dose 1), 4 and 10 weeks later for CV-AZ and AZ-CV groups, respectively (pre-dose 2), and 4 weeks after two-dose completion (post-dose 2). The data points are the reciprocals of the individuals. Lines indicate median and bars indicate interquartile ranges. As a reference, anti-N IgG and anti-S1 IgA were compared 4 weeks after completion of the two doses (post-dose 2) among homologous CV and AZ vaccines. ** indicates p< .001.
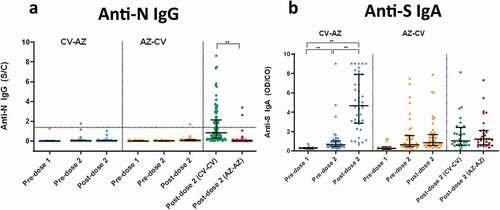
Figure 4. Serum neutralizing activities against wild-type SARS-CoV-2 using the surrogate viral neutralization test (sVNT) by Euroimmun (NeutraLISA) in CV- AZ and AZ-CV groups at 4 and 10 weeks after first dose vaccination, respectively (pre-dose 2), and at 4 weeks after completion of two doses (post-dose 2). The data points are the reciprocals of the individual. Lines indicate median and bars indicate interquartile ranges. As a reference, serum neutralizing activities were compared 4 weeks after completion of two doses (post-dose 2) among homologous CV and AZ vaccines. ** indicates p< .001.
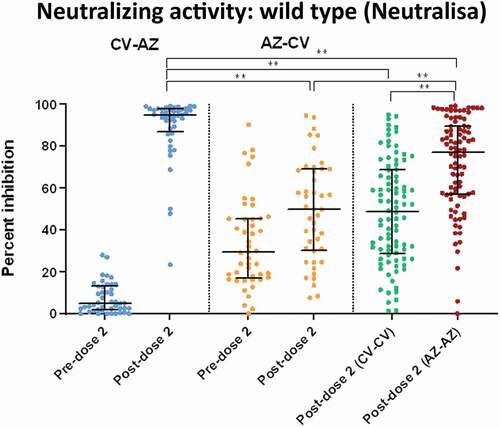
Figure 5. Serum neutralizing activities against wild-type SARS-CoV2 and variants of concern (alpha, beta, and delta) in heterologous and homologous vaccine recipients 1 month after completion of two doses. The data points are the reciprocals of the individual. Lines indicate median and I-bars indicate interquartile ranges. ** indicates p< .001.
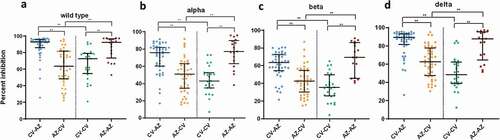
Figure 6. Comparison of subtracted IFN-γ responses using QFN SARS-CoV-2 antigen specific to CD4+ T cells (Ag 1) and CD4+ plus CD8+ T cells (Ag 2) in (a) heterologous CV-AZ vaccines and (b) heterologous AZ-CV vaccines at pre-dose 2 and post-dose 2. A two-tailed pair-matched comparison was performed using the Wilcoxon signed-rank test to analyze the significant differences. ** indicated p< .001.
Supplemental Material
Download MS Word (22.7 KB)Data availability statement
The data that support the findings of this study are available on request from the corresponding author. Although the data is de-identified and anonymous, they are not publicly available due to the restrictions of the Institutional Review Board.