
Figures & data
Table 1. Distribution of sociodemographic
Figure 1. Prevalence of staff that refuse infant vaccination.
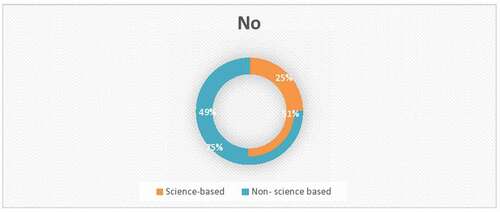
Table 2. Level of knowledge and attitude
Table 3. Association between socio-demographic and knowledge
Table 4. Association between socio-demographic and attitude
Table 5. Comparison of knowledge and attitude between staff in science-based and non-science-based faculty