1,626
Views
3
CrossRef citations to date
0
Altmetric
Melanoma Immunotherapy SF – Research Paper

Circulating immune profile can predict survival of metastatic uveal melanoma patients: results of an exploratory study

ORCID Icon, , , , , , , , , , , , , & show all
Article: 2034377 | Received 19 Sep 2021, Accepted 14 Dec 2021, Published online: 08 Mar 2022

Figures & data

Table 1. Patients’ characteristics

Figure 1. Baseline levels of cytokines and soluble immune checkpoint inhibitors can select patients with better survival. A-C. ROC curve analysis for the identified molecules: A: HVEM; B IDO ratio; C: IL-8. The values were compared between patients with a survival <6 months or ≥6 months using the Mann–Whitney test.
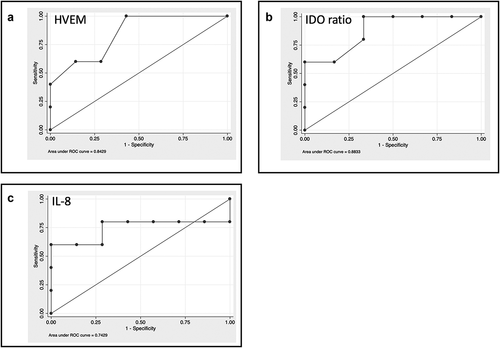
Figure 1. Baseline levels of cytokines and soluble immune checkpoint inhibitors can select patients with better survival. A-C. ROC curve analysis for the identified molecules: A: HVEM; B IDO ratio; C: IL-8. The values were compared between patients with a survival <6 months or ≥6 months using the Mann–Whitney test.

Figure 2. A score based on cytokines and soluble immune checkpoint inhibitors can predict patients’ survival. A. Overall score for total sample and by patients’ survival. B. ROC curve analysis for the overall score. A score of 1 was assigned to values higher than the cutoff for each of the three identified molecules; an overall score ranging from 0 to 3 was obtained by summing single scores. C. Patients survival based on the score: solid line: patients with score 2–3; dotted line: patients with score 0–1.
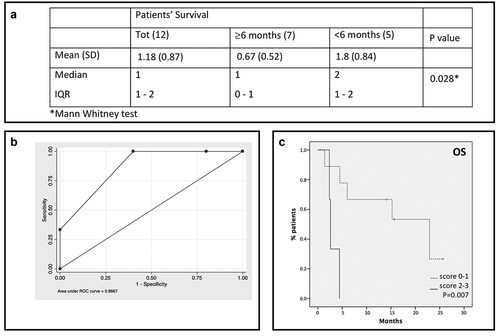
(OS: overall survival. SD: standard deviation. IQR: interquartile range).
Figure 2. A score based on cytokines and soluble immune checkpoint inhibitors can predict patients’ survival. A. Overall score for total sample and by patients’ survival. B. ROC curve analysis for the overall score. A score of 1 was assigned to values higher than the cutoff for each of the three identified molecules; an overall score ranging from 0 to 3 was obtained by summing single scores. C. Patients survival based on the score: solid line: patients with score 2–3; dotted line: patients with score 0–1.

Figure 3. Profiling of soluble immune molecules in UM patients stratified according to the course of metastatic disease. A. UM patients were classified in Fast progressor (FP), slow progressor (LP) and long survivor (LS). In the histograms, the serum levels of each protein were reported as average value ± SEM: B. Levels of IL-8 (FP: 212.31 pg/ml ± 114.3; SP: 12.33 ± 4.017; LS: 6.333 ± 2.348), sHVEM (FP: 325.6 pg/ml ± 282; SP: 94.91 pg/ml ± 41.98; LS: 6.8 ± 1.562) and IDO activity (FP: 0.047 ± 0.021; SP: 0.02 ± 0.007; LS: 0.023 ± 0.006). C. sCD137 (FP: 361.8 pg/ml ± 123.1; SP: 140.1 pg/ml ± 16.77; LS: 65.5 pg/ml ± 20.75), sGITR (FP: 70.2 pg/ml ± 29.81; SP: 25.33 ± 6.644; LS: 11.4 ± 0.4) and sCD27 (FP: 10258 ± 3758; SP: 6027 ± 870.5; LS: 2610 ± 460.5). ANOVA test was used to compare three groups. Student’s unpaired t-test for two groups. p < .05 was considered statistically significant.

(OS: overall survival. FP: fast progressors, with a survival <6 months. SP: slow progressors, with a survival >6 months and <30 months. LS: long survivors, with a survival >30 months).
Figure 3. Profiling of soluble immune molecules in UM patients stratified according to the course of metastatic disease. A. UM patients were classified in Fast progressor (FP), slow progressor (LP) and long survivor (LS). In the histograms, the serum levels of each protein were reported as average value ± SEM: B. Levels of IL-8 (FP: 212.31 pg/ml ± 114.3; SP: 12.33 ± 4.017; LS: 6.333 ± 2.348), sHVEM (FP: 325.6 pg/ml ± 282; SP: 94.91 pg/ml ± 41.98; LS: 6.8 ± 1.562) and IDO activity (FP: 0.047 ± 0.021; SP: 0.02 ± 0.007; LS: 0.023 ± 0.006). C. sCD137 (FP: 361.8 pg/ml ± 123.1; SP: 140.1 pg/ml ± 16.77; LS: 65.5 pg/ml ± 20.75), sGITR (FP: 70.2 pg/ml ± 29.81; SP: 25.33 ± 6.644; LS: 11.4 ± 0.4) and sCD27 (FP: 10258 ± 3758; SP: 6027 ± 870.5; LS: 2610 ± 460.5). ANOVA test was used to compare three groups. Student’s unpaired t-test for two groups. p < .05 was considered statistically significant.

Figure 4. Modulation of soluble immune molecules in mUM patients during anti-PD-1 treatment. Levels of soluble immune checkpoint proteins and inflammatory cytokines/chemokines were measured in sera of metastatic uveal melanoma patients at baseline (T0) and during anti-PD-1 treatment (>T0). Proteins were analyzed by Luminex multiplex beads and results are reported as concentration (pg/ml). A-C. sCD137, sCD28, sPD-1, sLAG3, sTim3, sPD-L2 and sCD80; D. chemokines IP-10 and CCL2. E. IDO activity measured as KYN/trp ratio. The kyn/trp ratio was reported as average value ± SEM (T0: 0.033 ± 0.015; >T0: 0.063 ± 0.032). Wilcoxon matched-pairs signed rank test was used and a p value <.05 was considered statistically significant.

Figure 4. Modulation of soluble immune molecules in mUM patients during anti-PD-1 treatment. Levels of soluble immune checkpoint proteins and inflammatory cytokines/chemokines were measured in sera of metastatic uveal melanoma patients at baseline (T0) and during anti-PD-1 treatment (>T0). Proteins were analyzed by Luminex multiplex beads and results are reported as concentration (pg/ml). A-C. sCD137, sCD28, sPD-1, sLAG3, sTim3, sPD-L2 and sCD80; D. chemokines IP-10 and CCL2. E. IDO activity measured as KYN/trp ratio. The kyn/trp ratio was reported as average value ± SEM (T0: 0.033 ± 0.015; >T0: 0.063 ± 0.032). Wilcoxon matched-pairs signed rank test was used and a p value <.05 was considered statistically significant.

Figure 5. Immune profile of mUM patients compared to mCM. A. PFS and OS of patients treated with an anti-PD-1 as first line treatment for metastatic disease. Solid line: uveal melanoma. Dotted line: cutaneous melanoma. B-E. mUM patients were compared to CM patients, both treated with anti-PD-1 therapy. In the scatter plot the longest bars represent the average value, the shortest ones indicate the error bar (± SEM). B. sGITR (mUM: 52.49 pg/ml ± 20.56; mCM: 12.88 ± 2.065) and sCD27 (mUM: 8204 ± 2190, mCM: 3025 ± 641.4); C. sPD-1 (mUM: 129.6 ± 34.79; mCM: 40.18 ± 13.84; D. levels of sCD80 (mUM: 630.9 ± 185.6; mCM: 240.1 ± 113.1); E. IFNγ (mUM: 258.1 ± 92.4; mCM: 4.778 ± 1.665). F. The histogram shows the IDO activity (Kyn/trp ratio) in mUM and CM (UM: 0.069 ± 0.01; CM: 0.035 ± 0.0036).
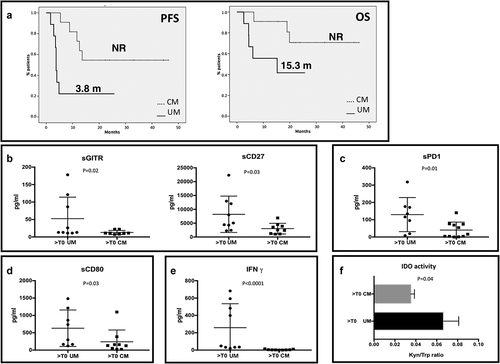
(PFS: progression-free survival. OS: overall survival. UM: uveal melanoma. CM: cutaneous melanoma. NR: not reached).
Figure 5. Immune profile of mUM patients compared to mCM. A. PFS and OS of patients treated with an anti-PD-1 as first line treatment for metastatic disease. Solid line: uveal melanoma. Dotted line: cutaneous melanoma. B-E. mUM patients were compared to CM patients, both treated with anti-PD-1 therapy. In the scatter plot the longest bars represent the average value, the shortest ones indicate the error bar (± SEM). B. sGITR (mUM: 52.49 pg/ml ± 20.56; mCM: 12.88 ± 2.065) and sCD27 (mUM: 8204 ± 2190, mCM: 3025 ± 641.4); C. sPD-1 (mUM: 129.6 ± 34.79; mCM: 40.18 ± 13.84; D. levels of sCD80 (mUM: 630.9 ± 185.6; mCM: 240.1 ± 113.1); E. IFNγ (mUM: 258.1 ± 92.4; mCM: 4.778 ± 1.665). F. The histogram shows the IDO activity (Kyn/trp ratio) in mUM and CM (UM: 0.069 ± 0.01; CM: 0.035 ± 0.0036).
Supplemental material

Supplemental Material

Download MS Word (95.9 KB)