
Figures & data
Table 1. Background characteristics of study participants and MCV1 coverage by various background characteristics among children aged 12–23 months in Ethiopia
Figure 1. MCV1 vaccination rate among children aged 12–23 months across regions of Ethiopia, EMDHS 2019.
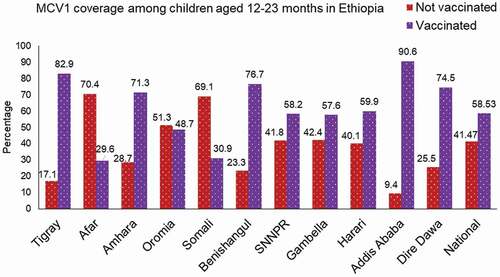
Figure 2. The spatial distribution of MCV1 vaccination rate across regions of Ethiopia, 2019 EMDHS.
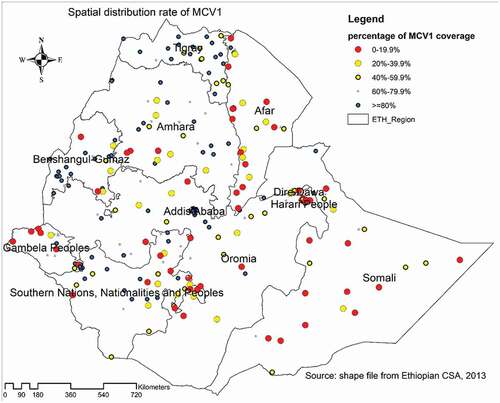
Figure 3. Spatial autocorrelation of MCV1 among children aged 12–23 months across regions of Ethiopia, EMDHS 2019.
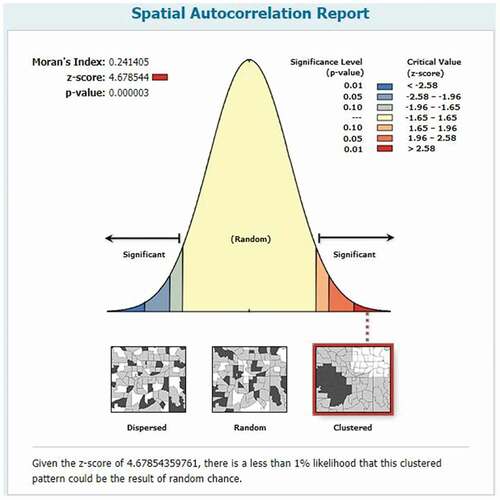
Figure 4. Spatial pattern of hotspots and cold spots of MCV1 rate across regions in Ethiopia, EMDHS 2019.
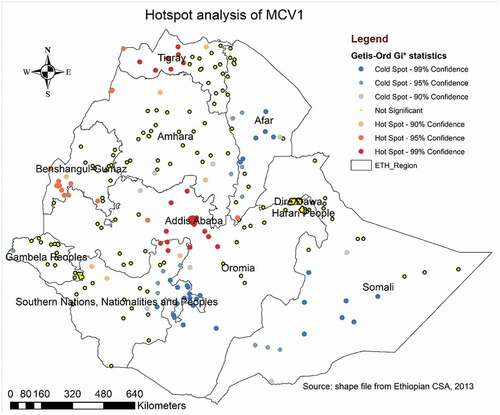
Table 2. SaTScan analysis of measles vaccination among children aged 12–23 months in Ethiopia
Figure 5. SaTScan analysis of measles vaccination among children aged 12–23 months across zones in Ethiopia, 2019 EMDHS.
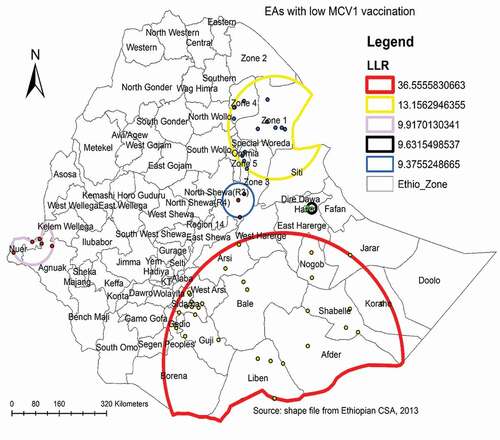
Table 3. Model comparison and random effect analysis result
Table 4. Multivariable multilevel logistic regression analysis of individual and community-level factors associated with measles vaccination among children aged 12–23 months in Ethiopia
Data availability statement
The dataset used for this study is publicly available at the MEASURE DHS program website https://www.dhsprogram.com/data.