Figures & data
Table 1. List of HZ-/PHN-related medications and pain medications
Figure 1. Flow chart of selection of subjects from (a) commercial/Medicare databases and (b) Medicaid database.
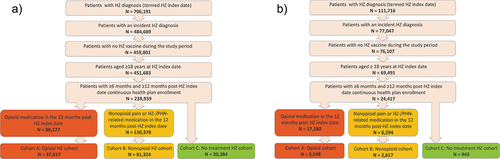
Table 2. Demographic and clinical characteristics - matched populations
Table 3. Opioid dosage patterns
Table 4. Factors associated with receipt of opioid medication from multivariable logistic regression analysis – commercial database
Figure 2. Adjusted health care costs by time from HZ Index date and by type of complication.
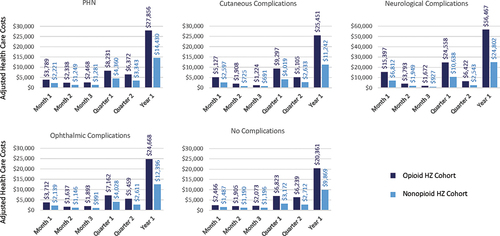
Table 5. Adjusted health care costs by time from HZ index date and by payer
Table 6. Health care resource utilization and costs, by cohort (month 1 after the index date)
Figure 3. Adjusted health care costs in the 1-year after the HZ index date, by age.
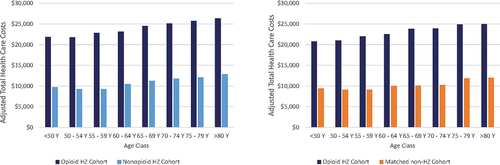
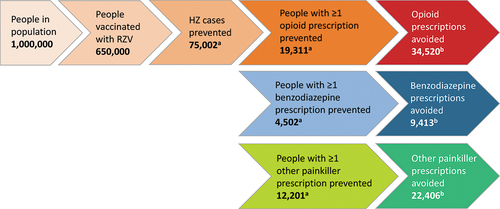
Figure 4. HZ-related prescriptions avoided with RZV vaccination in a population of 1 million adults aged ≥50 years .